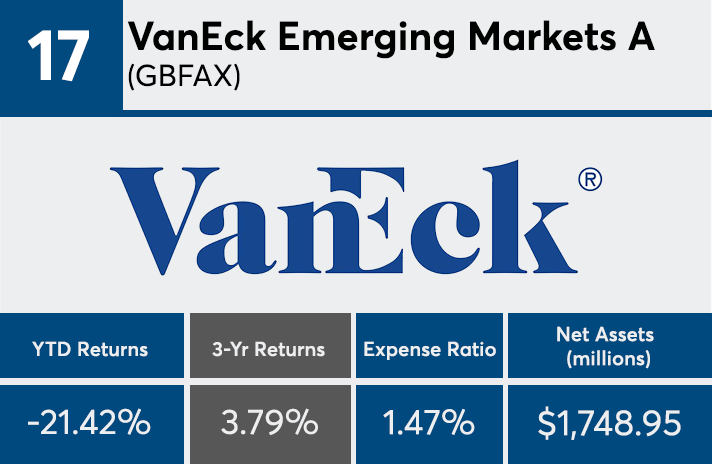
A narrow focus compounded by high fees are some of the leading causes behind the poor returns of this year’s worst-performing mutual funds and ETFs.
Among those that ranked at the bottom of the pack — with losses exceeding 20% as the end of the year draws close — commodities, emerging markets and homebuilder funds dominated the list. These funds held approximately $21 billion in client assets, according to Morningstar Direct data.
“The worst-performing funds this year, and in most any year, tend to be narrow segments of the market,” says Greg McBride, senior financial analyst at Bankrate, adding that, “sector investing is a supplement to, not a replacement for, owning broad-based funds that invest across entire markets, covering all sizes of market capitalization, and both growth and value disciplines.”
Expense ratios among the worst-performers were higher than of those with the best year-to-date return figures, data show. At an average 1.01%, these 20 funds charged nearly 15 basis points higher than the average top-performing fund. The average expense ratio of the 20
Both extremes of the fund universe, however, came at a costly price to clients. On average, investors paid just 0.52% for fund investing last year, according to a Morningstar study that reviewed the asset-weighted average expense ratios of nearly 25,000 U.S. mutual funds and ETFs. That was 8% less than how much they paid in 2016.
“Investing in smaller, narrower segments of the market is often feast or famine,” McBride says. “There will be years when the performance leads the pack and years when it trails badly.”
For advisors with clients worried about poor returns having an impact on their retirement portfolios, McBride says sticking to long-term strategy is the best advice. “Even in the face of poor short-term performance, the long-term thesis may still be valid.”
Scroll through to see the 20 mutual funds and ETFs with the worst YTD returns. Return figures are as of Dec. 6. Funds with investment minimums over $100,000 were excluded, as were leveraged and institutional funds. Three-year returns, assets and expense ratios for each fund are also listed. All data from Morningstar Direct.


