p195e8h0urtkqjel1arj14pq13p54.jpg

10 U.S. Equity Mutual Fund Bargains

Many investors often look at funds' past performance to make their fund selections, but a better, more dependable gauge of future performance are expense ratios, says Russell Kinnel, director of mutual fund research at Morningstar.

Indeed, expense ratios would have helped investors make better decisions in all asset classes in 2008, 2009 and 2010, Russel contends. "Expenses are just so dependable that it makes sense to make them an initial screen in your process," he writes on Morningstar.com.

With that in mind, Bank Investment Consultant and sister publications On Wall Street and Financial Planning searched for good mutual fund bargains. Here are 10 Morningstar gold- and silver-rated, five-star, no-load, U.S. equity mutual funds with expense ratios less than .50% that you might want to keep in mind for your clients. All values are as of 10/28/14.

For a single-page text version of this slideshow, click here.

—Margarida Correia
p195e7ilnu1vld5hnk312a3d7o5.jpg

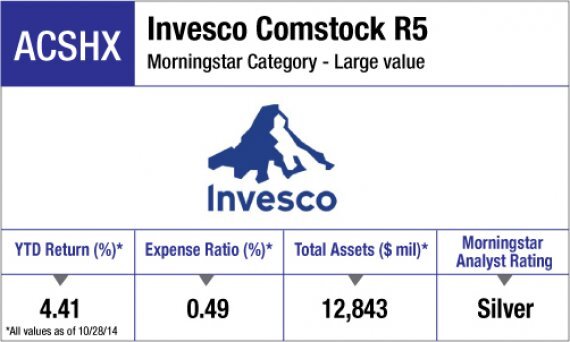
Invesco Comstock R5 (ACSHX)

Morningstar Analyst Rating: Silver
Morningstar Category: Large value
YTD Return (%): 4.41
Expense Ratio (%): 0.49
Total Assets ($mil): 12,843
p195e7j7aak711pvp15d91jpf1tb6.jpg

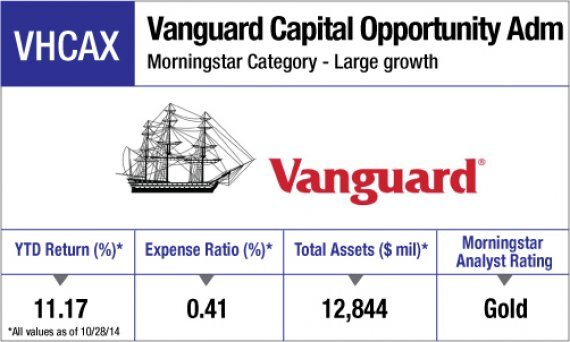
Vanguard Capital Opportunity Adm (VHCAX)

Morningstar Analyst Rating: Gold
Morningstar Category: Large growth
YTD Return (%): 11.17
Expense Ratio (%): 0.41
Total Assets ($mil): 12,844
p195e7jj4d351ppc19r81unqi9t7.jpg

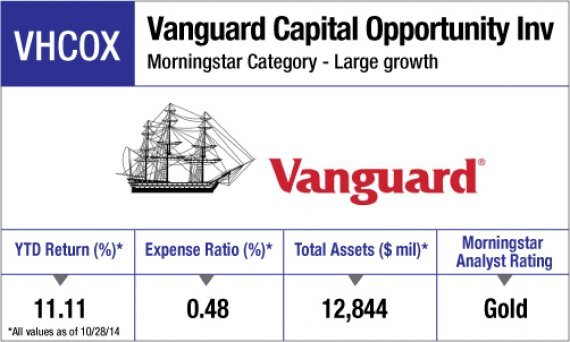
Vanguard Capital Opportunity Inv (VHCOX)

Morningstar Analyst Rating: Gold
Morningstar Category: Large growth
YTD Return (%): 11.11
Expense Ratio (%): 0.48
Total Assets ($mil): 12,844
p195e7jum21hs01ntjku32bg13if8.jpg

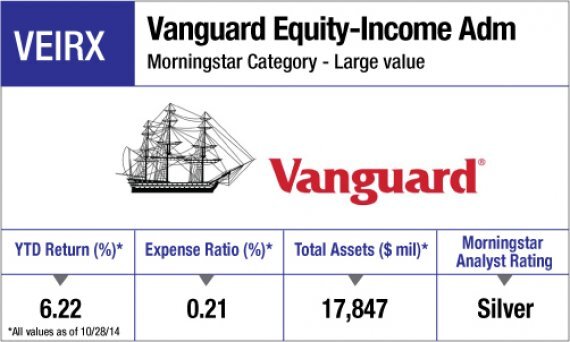
Vanguard Equity-Income Adm (VEIRX)

Morningstar Analyst Rating: Silver
Morningstar Category: Large value
YTD Return (%): 6.22
Expense Ratio (%): 0.21
Total Assets ($mil): 17,847
p195e7k9fs1fci1vn98f31qtl16699.jpg

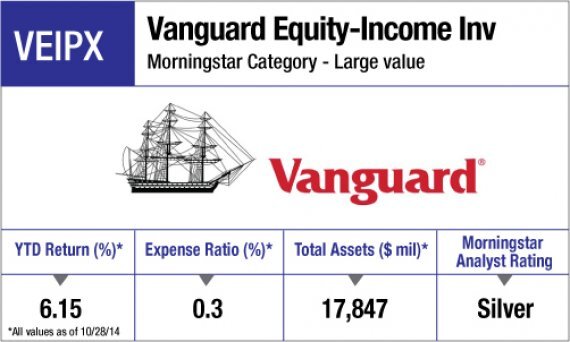
Vanguard Equity-Income Inv (VEIPX)

Morningstar Analyst Rating: Silver
Morningstar Category: Large value
YTD Return (%): 6.15
Expense Ratio (%): 0.3
Total Assets ($mil): 17,847
p195e7kjfj1jku16c21mt81mtvbqra.jpg

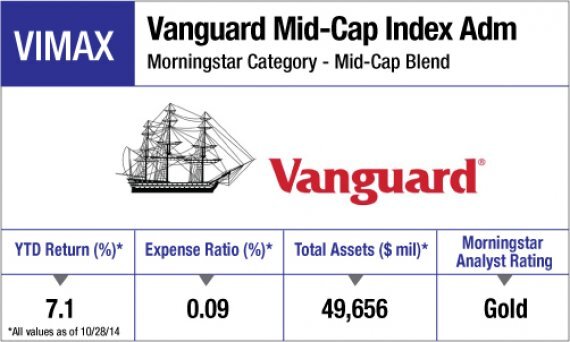
Vanguard Mid-Cap Index Adm (VIMAX)

Morningstar Analyst Rating: Gold
Morningstar Category: Mid-cap blend
YTD Return (%): 7.1
Expense Ratio (%): 0.09
Total Assets ($mil): 49,656
p195e7l0kcdt21nob1rma1g7u1sm9b.jpg

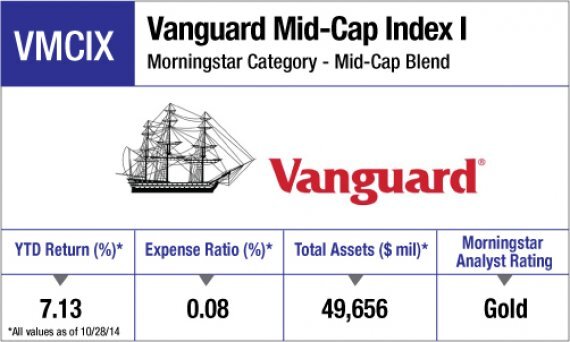
Vanguard Mid-Cap Index I (VMCIX)

Morningstar Analyst Rating: Gold
Morningstar Category: Mid-cap blend
YTD Return (%): 7.13
Expense Ratio (%): 0.08
Total Assets ($mil): 49,656
p195e7lb6v6511qov1ue91s921l9dc.jpg

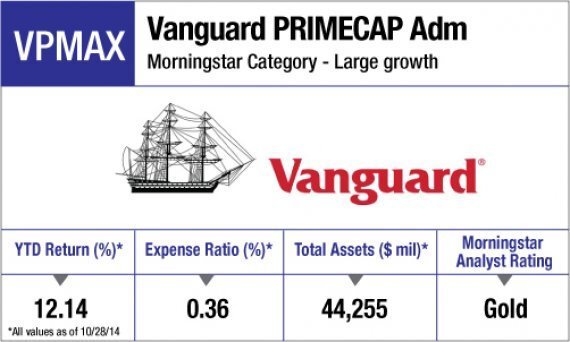
Vanguard PRIMECAP Adm (VPMAX)

Morningstar Analyst Rating: Gold
Morningstar Category: Large growth
YTD Return (%): 12.14
Expense Ratio (%): 0.36
Total Assets ($mil): 44,255
p195e7lkmc7aadhctot1lqv1cihd.jpg

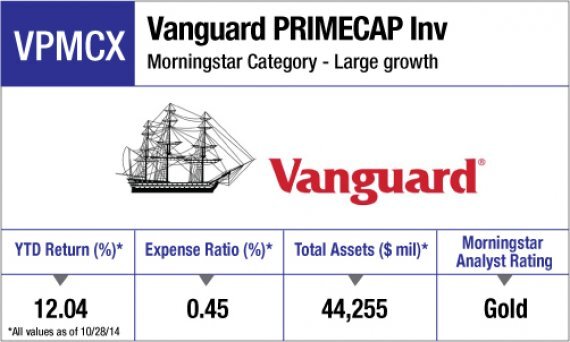
Vanguard PRIMECAP Inv (VPMCX)

Morningstar Analyst Rating: Gold
Morningstar Category: Large growth
YTD Return (%): 12.04
Expense Ratio (%): 0.45
Total Assets ($mil): 44,255
p195e7lt7tfcsq0nuaopfvkfte.jpg

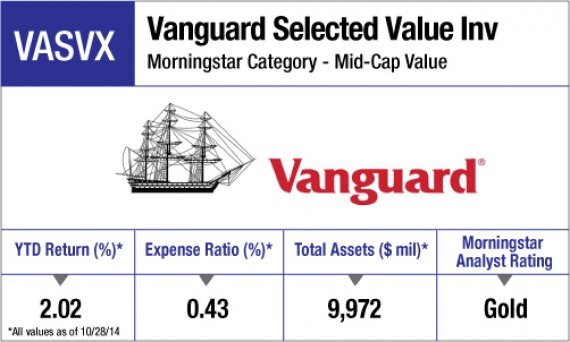
Vanguard Selected Value Inv (VASVX)

Morningstar Analyst Rating: Gold
Morningstar Category: Mid-cap value
YTD Return (%): 2.02
Expense Ratio (%): 0.43
Total Assets ($mil): 9,972
MORE FROM FINANCIAL PLANNING