FP91316_0.png

FP50 2016: Which IBDs have the most client assets?

For a striking example of how much assets under management vary across the independent broker-dealer industry, look no farther than LPL Financial. The firm has double to eight times the AUM of its main competitors, according to Financial Planning’s annual IBD survey.

The survey also showed that AUM growth has been lackluster across the industry — four IBDs reported a decline, compared to the prior year. Click through to see how the firms stack up against each other.

For more in-depth coverage, please see A shakeout for the nation's biggest IBDs. Take a deep dive into the data with our list of Top 10 IBDs by revenue growth, the IBDs with the most female reps and IBDs with the highest commission revenue.

Data is of year-end 2015.
FP91316_10.png

10. Royal Alliance Associates

Total AUM ($000): $57,020,800
% Change: -4.3%
FP91316_9.png

9. Securities America

Total AUM ($000): $57,800,000
% Change: 2.1%
FP91316_8.png

8. Northwestern Mutual Investment Services

Total AUM ($000): $59,570,755
% Change: 2.4%
FP91316_7.png

7. Kestra Financial

Total AUM ($000): $70,371,926
% Change: 5.2%
FP91316_6.png

6. MML Investors Services

Total AUM ($000): $70,677,555
% Change: -1.1%
FP91316_5.png

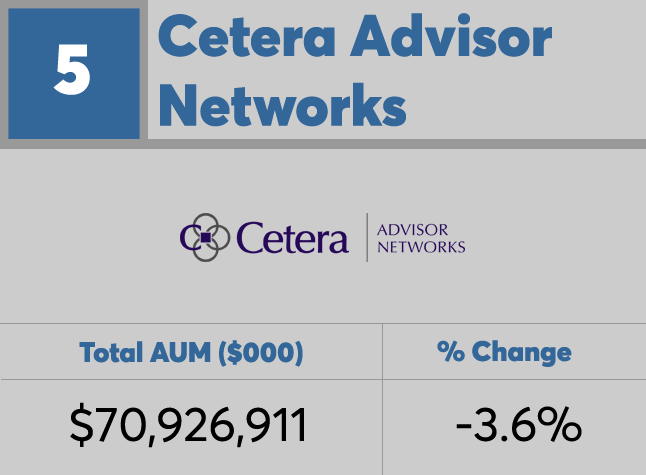
5. Cetera Advisor Networks

Total AUM ($000): $70,926,911
% Change: -3.6%
FP91316_4_edited-1.png

4. Commonwealth Financial Network

Total AUM ($000): $101,400,000
% Change: 4.8%
FP91316_3.png

3. AXA Advisors

Total AUM ($000): $110,671,000
% Change: -1.1%
FP91316_2.png

2. Raymond James Financial Services

Total AUM ($000): $208,460,898
% Change: 1.8%
FP91316_1.png

1. LPL Financial

Total AUM ($000): $475,565,604
% Change: 0.1%
MORE FROM FINANCIAL PLANNING