10 ways RIAs and hybrids differ, by the numbers

Count of U.S. RIAs by firm type

Dividing RIAs by their size and whether they have a brokerage affiliation reveals differences in the types of clients and amount of assets managed among the industry’s more than 5,000 firms.

Despite the difficult year for the world in 2020, retail-facing RIAs of all types grew substantially last year in terms of the number of firms and their quantity of assets under management, according to a report on the industry released Oct. 5 by consulting firm Aite-Novarica Group. Author William Whitt, a strategic advisor with the firm’s wealth management unit, gathered the figures using the firms’ SEC Form ADV filings in the first quarter of 2021.

The industry’s two most significant distinctions — between big and small firms and dually registered or fee-only practitioners — jump out of the data in notable ways. For one, a larger percentage of hybrid RIAs provide planning services to clients and accept hourly or fixed fees, despite those business models being more commonly associated with fee-only firms. Secondly, and less surprisingly, the larger RIAs have the most AUM and the biggest number of accounts per advisory representative. The variance between firms’ clientele in terms of whether they’re primarily high net worth and how many they have also comes through clearly in the report.

Disparities in the number of accounts and AUM per rep display “the advantages of scale,” Whitt said in an interview.

“There was literally almost no difference between the fee-only firms and the hybrid firms, but you saw dramatic differences when you sorted the firms by size,” Whitt said. “The larger firms have more resources to devote to building out an infrastructure, and that infrastructure allows advisors to become more productive.”

The findings may prompt celebration among RIA consolidators offering practices greater reach through the record M&A, although Whitt says he also understands that smaller firms could use the greater attention to a smaller base of clients as a selling point. For vendors of software or other technology, the figures suggest that smaller firms need “fully designed platforms” while bigger RIAs would benefit more from capabilities they can integrate into their desktops, he adds.

Just as reflected in Financial Planning’s annual RIA Leaders study last month, the lack of standardized regulatory classification among the many kinds of RIAs requires researchers to divide up retail-facing advisory firms themselves. In the Aite-Novarica study, Whitt described firms as “fee-only” based on not having any registered reps of a broker-dealer or doing business as one; as “hybrid RIAs” when they didn’t do business as BDs but did have registered reps; and as “broker-dealers” when they were dually registered as RIAs like most large wealth managers.

“It's a mix of art and science,” Whitt said. “We have to make our own categories and make our definitions.”

To see 10 of the most interesting takeaways from the Aite-Novarica study, scroll down our slideshow. Note: All data comes from SEC Form ADV filings that reflect year-end figures for 2020, as compiled by Aite-Novarica Group.
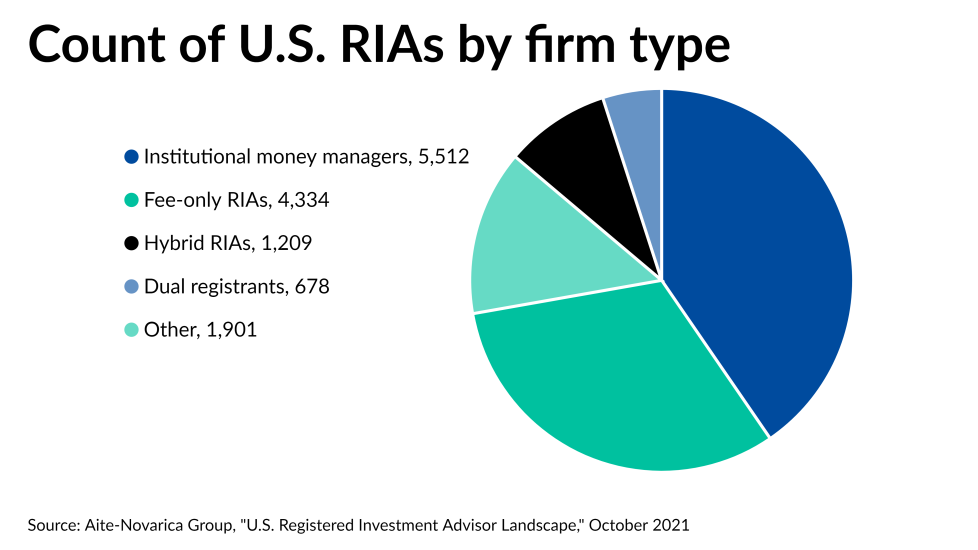
Most RIAs are institutional money managers

Aite RIA report slideshow/IAG.TOS.AiteRIAslide1.png

Dually registered wealth managers’ RIAs have more AUM than any other type of firm

Aite RIA report slideshow/IAG.TOS.AiteRIAslide2.png

AUM of hybrid and fee-only RIAs jumped substantially in 2020

Aite RIA report slideshow/IAG.TOS.AiteRIAslide4.png

The count of fee-only RIAs is growing faster than that of hybrid firms

Aite RIA report slideshow/IAG.TOS.AiteRIAslide3.png

Differences in client types among fee-only RIAs and hybrid firms

Aite RIA report slideshow/IAG.TOS.AiteRIAslide5.png

Hybrid RIAs are more likely to use hourly and fixed fees

Aite RIA report slideshow/IAG.TOS.AiteRIAslide6.png

Hybrid RIAs are more likely to offer planning services

Aite RIA report slideshow/IAG.TOS.AiteRIAslide7.png

Breakdown of all RIAs by firm size

Aite RIA report slideshow/IAG.TOS.AiteRIAslide8.png

Breakdown of AUM by size of RIAs

Aite RIA report slideshow/IAG.TOS.AiteRIAslide9.png

Number of accounts per IAR among firms of different sizes

Aite RIA report slideshow/IAG.TOS.AiteRIAslide10.png
MORE FROM FINANCIAL PLANNING