20 best-performing value funds of the decade

It may be tough to find any cause for concern when evaluating the gains made by the industry’s best-performing value funds.

The 20 with the biggest 10-year gains, and at least $100 million in assets, have matched, if not bested, broader indexes and peers with an average 16% annualized return, Morningstar Direct data show. The same funds also had an overall 51% gain over the past 12 months. 

For comparison, index trackers such as the SPDR S&P 500 ETF Trust (SPY) and SPDR Dow Jones Industrial Average ETF (DIA) notched 10-year returns of 16% and 14.24%, respectively, data show. Over the past year, SPY and DIA scored gains of 27.24% and 22.76%. In bonds, the iShares Core U.S. Aggregate Bond ETF (AGG) had a 10-year return of 2.98% and one-year loss of 1.2%, data show. 

The industry’s largest value fund, the $156.8 billion American Funds Washington Mutual A (AWSHX), posted one- and 10-year gains of 26.48% and 13.94%. 

So, what could be the problem from an advisor’s or client’s perspective? 

For one, high expectations for future gains to match past performance, said Brinker Capital portfolio manager Michael Hadden.

“The market as a whole has had a tremendous rally coming out of the initial shock of the COVID-19 crisis,” according to Hadden. “There has also been a shift in outperformance by value focused strategies over the past year. But as we look at the top 20 funds over the past decade, the consistency of strong performance should be stressed to clients.”

"Products that have a consistent proven process can help avoid performance chasing that is proven to be a loser’s game,” said Michael Hadden, portfolio manager at Brinker Capital.

Another area that should raise an eyebrow when analyzing these funds are their fees. With an average net expense ratio of nearly 88 basis points, the funds in this ranking were more than double the 0.41% asset-weighted average expense ratio across all funds in 2020, according to Morningstar’s latest fee study.

“In a time where fee cuts and low-cost index products have gathered lots of attention — and assets — it is as important of a time as ever to discuss fees and the nature of the fund with clients,” Hadden said, adding, “There is only one passive index product on the list. The other 19 funds are actively managed, often fairly concentrated and much different from their benchmarks.”

For advisors speaking with clients about their long-term investments, understanding the makeup of a product, the process employed by the manager and the corresponding fee charged for the product are all critical to ensure they aren’t overpaying for closet index exposure, Hadden said.

“Markets work in cycles, and as we’ve seen over the past decade, styles of investing can be out-of-favor for long periods, but using products that have a consistent proven process can help avoid performance chasing that is proven to be a loser’s game,” Hadden said. “Clients have different goals and time horizons, but in general, a focus on the long term should be stressed to help block out some of the short-term noise and volatility that is inevitable in the market.”

Scroll through to see the 20 value funds with the biggest 10-year returns, and at least $100 million in AUM, through Oct. 11. Net expense ratios, loads, investment minimums, and manager names, as well as YTD, one-, three-, five- and 15-year returns and month-end share class flows through May 1 are also listed. The data show each fund's primary share class. Leveraged, institutional and funds with investment minimums over $100,000 have been excluded. All data is from Morningstar Direct.
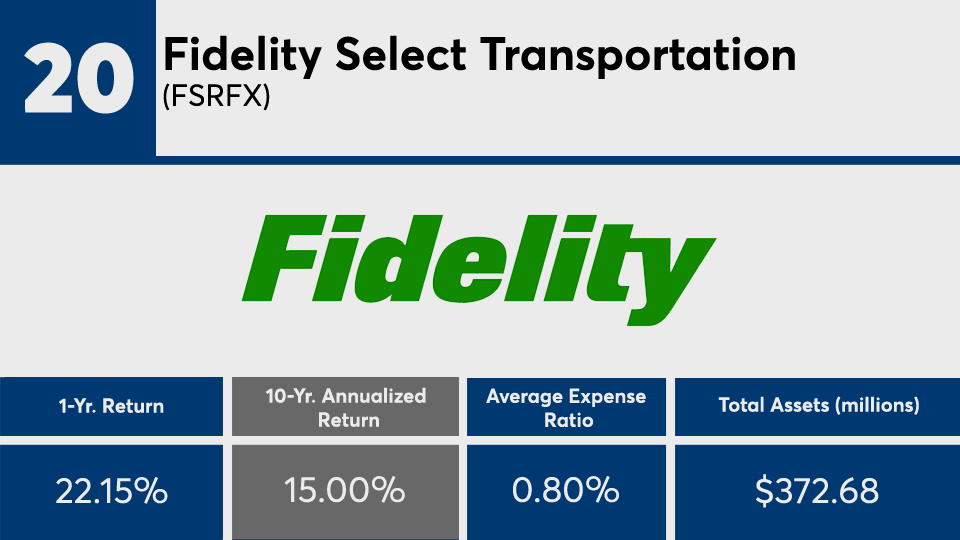
FP101321_20 copy.png
YTD Return: 15.66%; 3-Yr. Annualized Return: 11.53%; 5-Yr. Annualized Return: 13.68%; 15-Yr. Annualized Return: 10.8%; YTD Net Flow: (millions): ($8.34); 1-Yr. Net Flow (millions): ($19.54); 3-Yr. Net Flow (millions): ($195.57); 5-Yr. Net Flow (millions): ($266.14); 10-Yr. Net Flow (millions): ($278.84); 15-Yr. Net Flow (millions): ($220.20); Inception Date: Sept. 29, 1986; Manager Name: Matthew Moulis
FP101321_19 copy.png
YTD Return: 33.06%; 3-Yr. Annualized Return: 17.36%; 5-Yr. Annualized Return: 16.47%; 15-Yr. Annualized Return: 4.42%; YTD Net Flow: (millions): $183.46; 1-Yr. Net Flow (millions): $200.03; 3-Yr. Net Flow (millions): $1.63; 5-Yr. Net Flow (millions): ($633.19); 10-Yr. Net Flow (millions): ($330.47); 15-Yr. Net Flow (millions): ($272.95); Inception Date: Dec. 10, 1981; Manager Name: Matt Reed
FP101321_18 copy.png
YTD Return: 27.47%; 3-Yr. Annualized Return: 15.39%; 5-Yr. Annualized Return: 14.11%; 15-Yr. Annualized Return: 9.03%; YTD Net Flow: (millions): $176.58; 1-Yr. Net Flow (millions): $137.17; 3-Yr. Net Flow (millions): ($223.78); 5-Yr. Net Flow (millions): ($552.36); 10-Yr. Net Flow (millions): ($1,765.99); 15-Yr. Net Flow (millions): ($4,287.18); Minimum Initial Investment: $1,000; Inception Date: Nov. 6, 1986; Manager Name: John P. Miller, John W. Rogers and Kenneth E. Kuhrt
FP101321_17 copy.png
YTD Return: 32.65%; 3-Yr. Annualized Return: 15.66%; 5-Yr. Annualized Return: 14.5%; 15-Yr. Annualized Return: 8.33%; YTD Net Flow: (millions): $40.35; 1-Yr. Net Flow (millions): $27.99; 3-Yr. Net Flow (millions): ($110.27); 5-Yr. Net Flow (millions): ($193.38); 10-Yr. Net Flow (millions): ($364.32); 15-Yr. Net Flow (millions): ($1,001.83); Minimum Initial Investment: $2,000; Redemption Load: 2%; Inception Date: July 31, 1997; Manager Name: Elena Khoziaeva, Michael Whipple, Christine L. Wang and John N.R. Montgomery
FP101321_16 copy.png
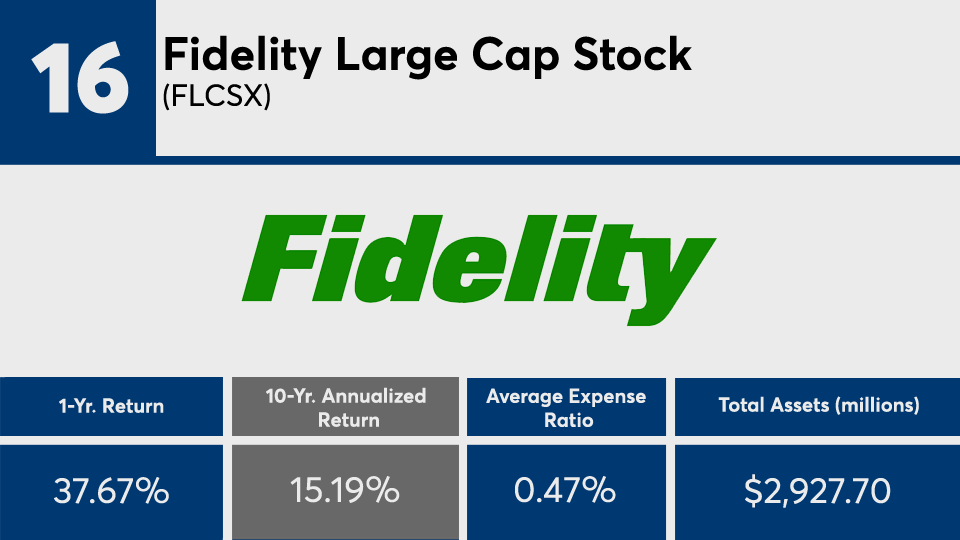
YTD Return: 20.3%; 3-Yr. Annualized Return: 15.1%; 5-Yr. Annualized Return: 14.78%; 15-Yr. Annualized Return: 10.12%; YTD Net Flow: (millions): ($96.32); 1-Yr. Net Flow (millions): ($273.87); 3-Yr. Net Flow (millions): ($996.77); 5-Yr. Net Flow (millions): ($1,613.55); 10-Yr. Net Flow (millions): ($1,040.99); 15-Yr. Net Flow (millions): ($1,007.08); Inception Date: June 22, 1995; Manager Name: Matthew W. Fruhan
FP101321_15 copy.png
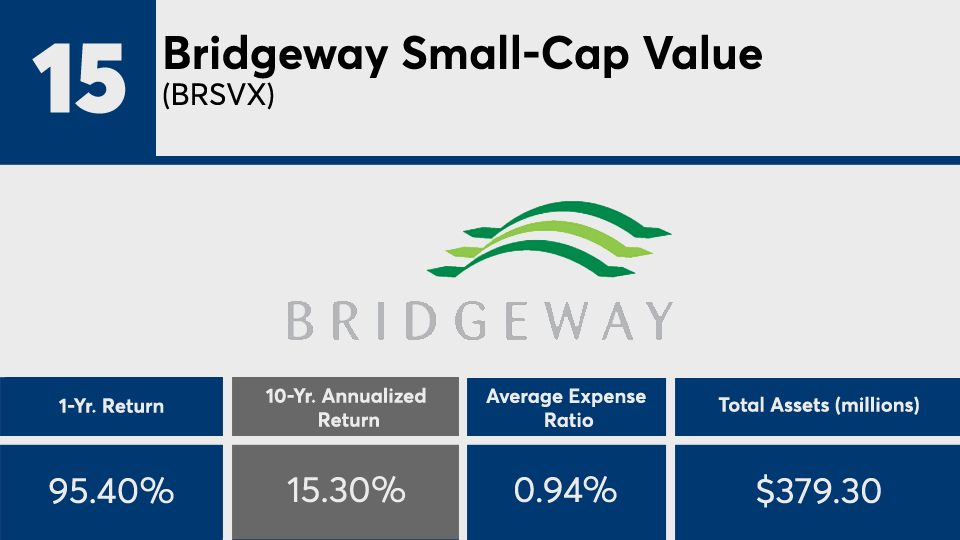
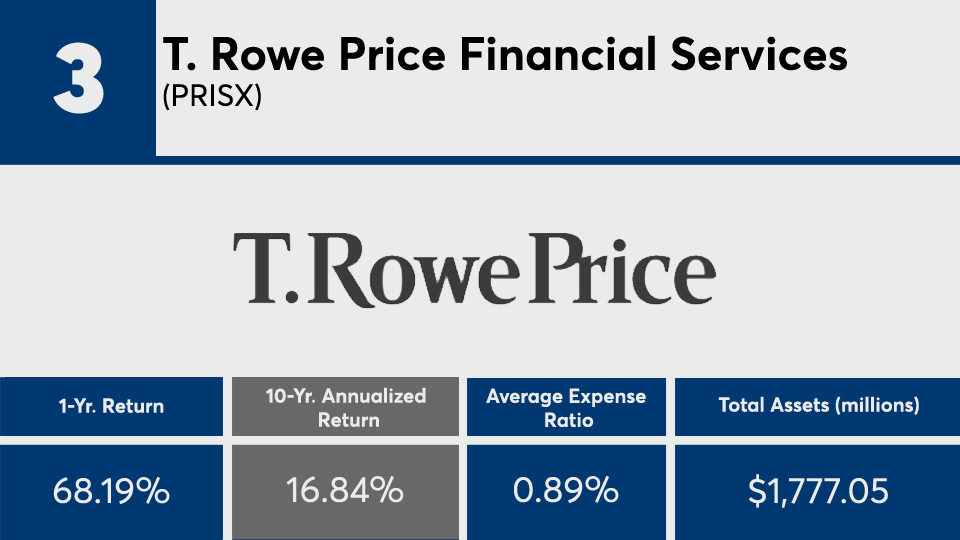
YTD Return: 61.67%; 3-Yr. Annualized Return: 19.94%; 5-Yr. Annualized Return: 17.72%; 15-Yr. Annualized Return: 8.5%; YTD Net Flow: (millions): $236.90; 1-Yr. Net Flow (millions): $236.02; 3-Yr. Net Flow (millions): $213.41; 5-Yr. Net Flow (millions): $204.02; 10-Yr. Net Flow (millions): $143.78; 15-Yr. Net Flow (millions): $34.21; Minimum Initial Investment: $2,000; Inception Date: Oct. 31, 2003; Manager Names: Elena Khoziaeva, Michael Whipple and John N.R. Montgomery
FP101321_14 copy.png
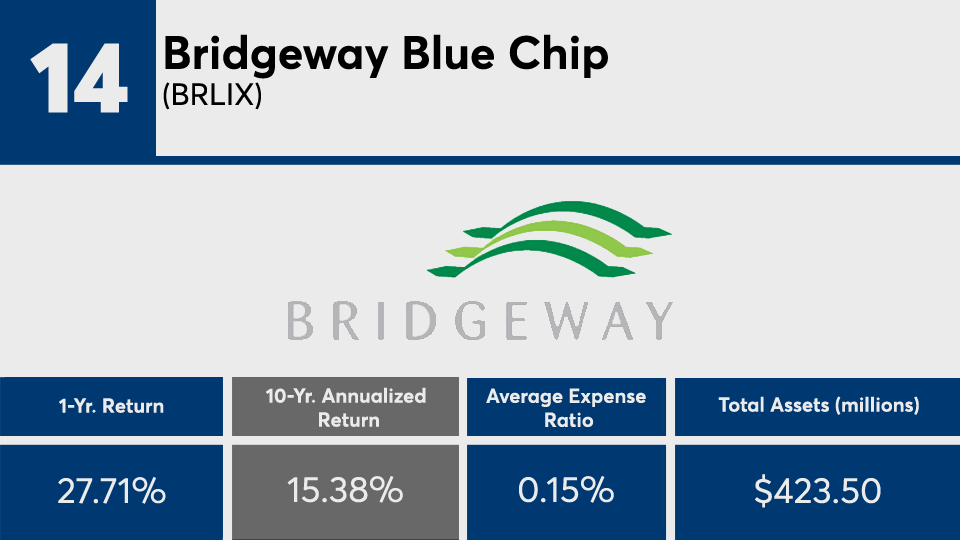
YTD Return: 16.35%; 3-Yr. Annualized Return: 17.93%; 5-Yr. Annualized Return: 16.24%; 15-Yr. Annualized Return: 10.07%; YTD Net Flow: (millions): ($92.48); 1-Yr. Net Flow (millions): ($108.94); 3-Yr. Net Flow (millions): ($358.37); 5-Yr. Net Flow (millions): ($455.46); 10-Yr. Net Flow (millions): ($513.56); 15-Yr. Net Flow (millions): ($238.28); Minimum Initial Investment: $2,000; Inception Date: July 31, 1997; Manager Name: Elena Khoziaeva, Michael Whipple, Christine L. Wang and John N.R. Montgomery
FP101321_13 copy.png
YTD Return: 25.65%; 3-Yr. Annualized Return: 15.45%; 5-Yr. Annualized Return: 12.79%; 15-Yr. Annualized Return: 7.25%; YTD Net Flow: (millions): ($10.76); 1-Yr. Net Flow (millions): ($19.56); 3-Yr. Net Flow (millions): ($89.24); 5-Yr. Net Flow (millions): ($549.22); 10-Yr. Net Flow (millions): ($480.85); 15-Yr. Net Flow (millions): ($429.87); Inception Date: Dec. 16, 1985; Manager Name: Peter Deutsch
FP101321_12 copy.png
YTD Return: 17.08%; 3-Yr. Annualized Return: 16.7%; 5-Yr. Annualized Return: 17.34%; 15-Yr. Annualized Return: 10.21%; YTD Net Flow: (millions): ($32.07); 1-Yr. Net Flow (millions): ($49.37); 3-Yr. Net Flow (millions): N/A; 5-Yr. Net Flow (millions): N/A; 10-Yr. Net Flow (millions): N/A; 15-Yr. Net Flow (millions): N/A; Minimum Initial Investment: $1,000; Redemption Load: 2%; Inception Date: Feb. 10, 1994; Manager Name: James England
FP101321_11 copy.png
YTD Return: 32.36%; 3-Yr. Annualized Return: 14.95%; 5-Yr. Annualized Return: 14.85%; 15-Yr. Annualized Return: 10.54%; YTD Net Flow: (millions): ($20.06); 1-Yr. Net Flow (millions): ($27.37); 3-Yr. Net Flow (millions): ($73.79); 5-Yr. Net Flow (millions): ($99.60); 10-Yr. Net Flow (millions): ($34.62); 15-Yr. Net Flow (millions): ($81.94); Minimum Initial Investment: $2,500; Front Load: 5.25%; Inception Date: Dec. 31, 2002; Manager Names: George H. Davis and David E. Green
FP101321_10 copy.png
YTD Return: 25.38%; 3-Yr. Annualized Return: 19.11%; 5-Yr. Annualized Return: 17.56%; 15-Yr. Annualized Return: 9.96%; YTD Net Flow: (millions): $372.10; 1-Yr. Net Flow (millions): $420.07; 3-Yr. Net Flow (millions): $229.68; 5-Yr. Net Flow (millions): $44.85; 10-Yr. Net Flow (millions): ($705.05); 15-Yr. Net Flow (millions): ($1,499.08); Minimum Initial Investment: $2,000; Redemption Load: 1%; Inception Date: Nov. 19, 1996; Manager Name: Boniface A. Zaino, James P. Stoeffel, Brendan J. Hartman, James J. Harvey and Kavitha Venkatraman
FP101321_9 copy.png
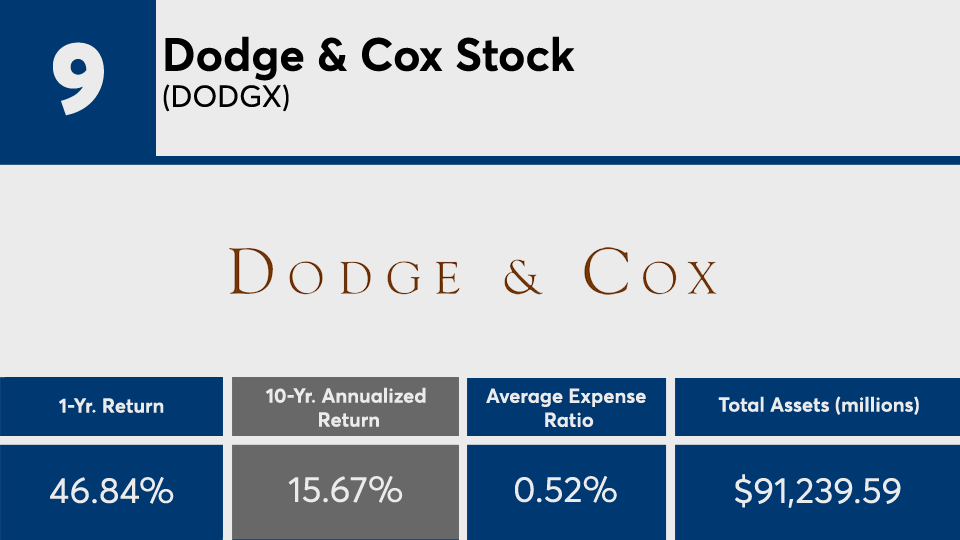
YTD Return: 27.19%; 3-Yr. Annualized Return: 15.82%; 5-Yr. Annualized Return: 15.82%; 15-Yr. Annualized Return: 8.76%; YTD Net Flow: (millions): $3,618.12; 1-Yr. Net Flow (millions): $1,381.71; 3-Yr. Net Flow (millions): ($8,508.04); 5-Yr. Net Flow (millions): ($12,074.23); 10-Yr. Net Flow (millions): ($25,320.09); 15-Yr. Net Flow (millions): ($38,157.01); Minimum Initial Investment: $2,500; Inception Date: Jan. 4, 1965; Manager Names: C. Bryan Cameron, Charles F. Pohl, David C. Hoeft, Steven C. Voorhis, Karol Marcin, Philippe Barret, Kathleen G. McCarthy, Benjamin V. Garosi and Karim A Fakhry
FP101321_8 copy.png
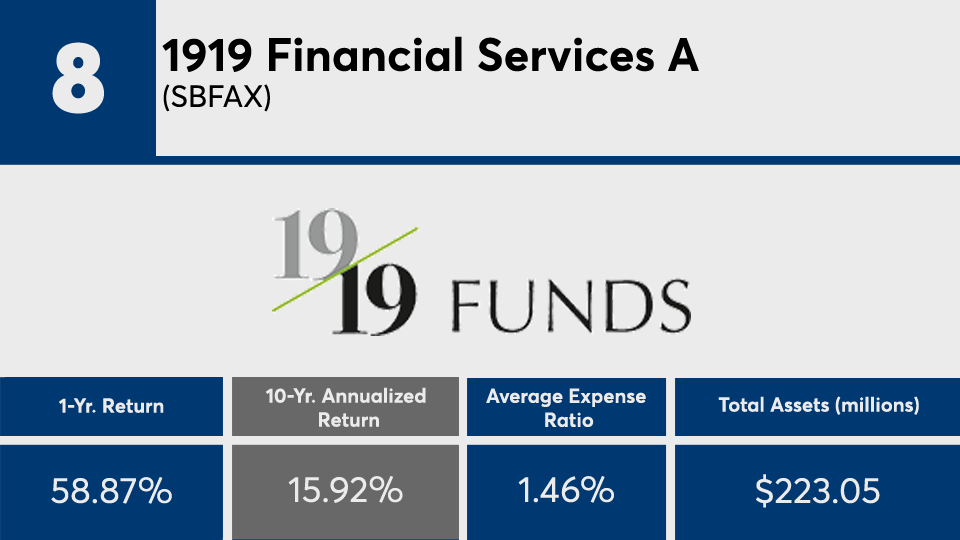
YTD Return: 27.95%; 3-Yr. Annualized Return: 12.6%; 5-Yr. Annualized Return: 14.21%; 15-Yr. Annualized Return: 8.14%; YTD Net Flow: (millions): ($0.08); 1-Yr. Net Flow (millions): ($2.64); 3-Yr. Net Flow (millions): ($30.71); 5-Yr. Net Flow (millions): ($37.13); 10-Yr. Net Flow (millions): ($30.35); 15-Yr. Net Flow (millions): ($28.47); Minimum Initial Investment: $1,000; Front Load: 5.75%; Inception Date: Nov. 16, 1998; Manager Names: Charles King and Mel J Casey
FP101321_7 copy.png
YTD Return: 37.86%; 3-Yr. Annualized Return: 9.54%; 5-Yr. Annualized Return: 12.99%; 15-Yr. Annualized Return: 6.88%; YTD Net Flow: (millions): ($48.54); 1-Yr. Net Flow (millions): ($71.37); 3-Yr. Net Flow (millions): ($438.55); 5-Yr. Net Flow (millions): ($363.29); 10-Yr. Net Flow (millions): ($503.71); 15-Yr. Net Flow (millions): ($1,181.87); Minimum Initial Investment: $1,000; Front Load: 5%; Inception Date: Jan. 3, 1992; Manager Names: Susan A. Curry and Ryan P. Lentell
FP101321_6 copy.png
YTD Return: 35.69%; 3-Yr. Annualized Return: 18.95%; 5-Yr. Annualized Return: 18.26%; 15-Yr. Annualized Return: 1.3%; YTD Net Flow: (millions): $150; 1-Yr. Net Flow (millions): $149.83; 3-Yr. Net Flow (millions): $168.76; 5-Yr. Net Flow (millions): $150.8; 10-Yr. Net Flow (millions): ($48.77); 15-Yr. Net Flow (millions): ($9); Inception Date: Dec. 16, 1985; Manager Name: Chuck Culp
FP101321_5 copy.png
YTD Return: 4.49%; 3-Yr. Annualized Return: 10.87%; 5-Yr. Annualized Return: 16.49%; 15-Yr. Annualized Return: 11.65%; YTD Net Flow: (millions): ($47.15); 1-Yr. Net Flow (millions): ($72.33); 3-Yr. Net Flow (millions): ($218.27); 5-Yr. Net Flow (millions): ($224.95); 10-Yr. Net Flow (millions): ($663.88); 15-Yr. Net Flow (millions): ($733.18); Inception Date: June 30, 1986; Manager Name: Justin Segalini
FP101321_4 copy.png
YTD Return: 32.97%; 3-Yr. Annualized Return: 15.57%; 5-Yr. Annualized Return: 16.32%; 15-Yr. Annualized Return: 5.11%; YTD Net Flow: (millions): $98.10; 1-Yr. Net Flow (millions): $109.61; 3-Yr. Net Flow (millions): ($71.05); 5-Yr. Net Flow (millions): $205.92; 10-Yr. Net Flow (millions): $322.89; 15-Yr. Net Flow (millions): $413.67; Minimum Initial Investment: $100,000; Inception Date: Feb. 4, 2004; Manager Names: William A. Coleman and Michelle Louie
FP101321_3 copy.png
YTD Return: 35.46%; 3-Yr. Annualized Return: 18.98%; 5-Yr. Annualized Return: 18.22%; 15-Yr. Annualized Return: 7.92%; YTD Net Flow: (millions): $547.99; 1-Yr. Net Flow (millions): $535.69; 3-Yr. Net Flow (millions): $336.93; 5-Yr. Net Flow (millions): $380.18; 10-Yr. Net Flow (millions): $374.40; 15-Yr. Net Flow (millions): $355.22; Minimum Initial Investment: $2,500; Inception Date: Sept. 30, 1996; Manager Name: Matt Snowling
FP101321_2 copy.png
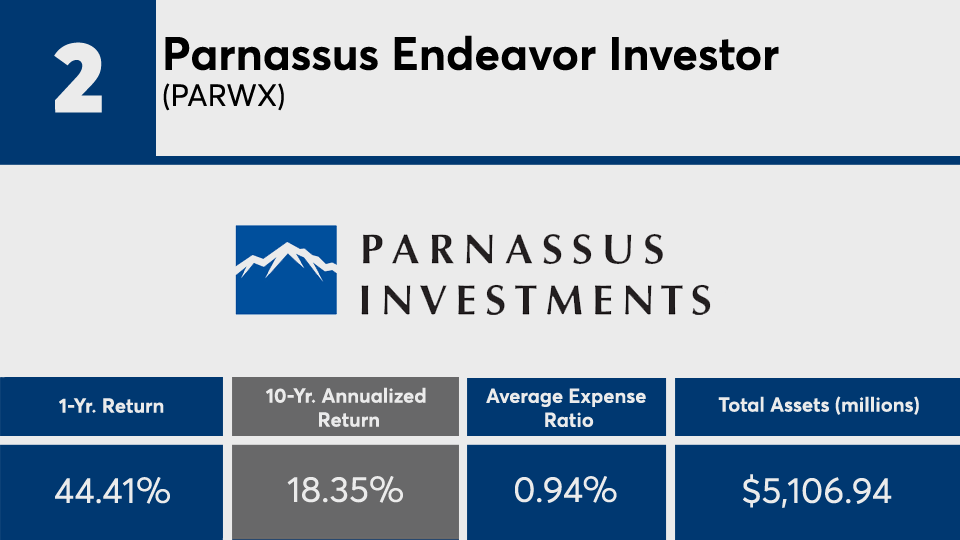
YTD Return: 21.8%; 3-Yr. Annualized Return: 22.43%; 5-Yr. Annualized Return: 18.47%; 15-Yr. Annualized Return: 13.83%; YTD Net Flow: (millions): $740.84; 1-Yr. Net Flow (millions): $624.56; 3-Yr. Net Flow (millions): ($1,451.56); 5-Yr. Net Flow (millions): ($163.48); 10-Yr. Net Flow (millions): $810.48; 15-Yr. Net Flow (millions): $1,014.46; Minimum Initial Investment: $2,000; Inception Date: April 29, 2005; Manager Name: Billy J. Hwan
FP101321_1 copy.png
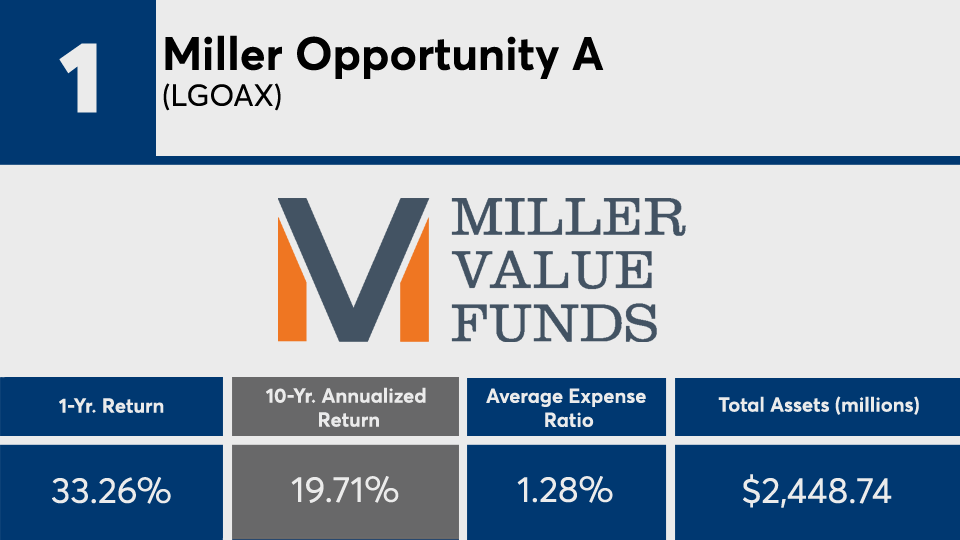
YTD Return: 6.2%; 3-Yr. Annualized Return: 17%; 5-Yr. Annualized Return: 18.25%; 15-Yr. Annualized Return: N/A; YTD Net Flow: (millions): ($28.06); 1-Yr. Net Flow (millions): ($33.07); 3-Yr. Net Flow (millions): $296.74; 5-Yr. Net Flow (millions): $288.39; 10-Yr. Net Flow (millions): $410.27; 15-Yr. Net Flow (millions): N/A; Minimum Initial Investment: $1,000; Front Load: 5.75%; Inception Date: Feb. 3, 2009; Manager Names: Bill Miller and Samantha McLemore
MORE FROM FINANCIAL PLANNING