Bond funds with the biggest 10-year gains

From the 2008 financial crisis to coronavirus, outperformance in fixed income over the past decade has come from funds that benefited the most from multiple rounds of Fed stimulus.

Among the 20 top-performing bond funds of the last 10 years, data show some of the industry’s longest duration funds produced the biggest gains. With an average total return of more than 7.38%, the best performers more than doubled the Bloomberg Barclays US Aggregate Bond Index’s 3.61% return over the same period, as measured by the iShares Core US Aggregate Bond ETF (AGG), according to Morningstar Direct. Looking back on the last 10 years of low rates stemming from the financial crisis, it’s no surprise these funds have registered such impressive gains, says Jeff Chang, co-founder and managing director at CBOE Vest in McLean, Virginia.

“High-duration products like these benefited the most from record monetary stimulus we saw coming out of the 2008 financial crisis and most recently from COVID-19 that flattened the yield curve,” Chang says. “Recent further Fed action from COVID-19 seems to put another layer on a near-40-year bond bull market. This why we see the long end of the yield curve drop to less than a third of what it was 10 years ago.”

When pitted against the industry’s largest bond funds, the top-performers — half of which are actively managed — trounced their average gain of just over 3%, data show. The industry’s biggest bond fund, the $269 billion Vanguard Total Bond Market Index Admiral (VBTLX), reported 10-year gains of 3.68% and YTD gain of 1.5%. On the equities side, the largest overall fund, the $840.9 billion Vanguard Total Stock Market Index Fund Admiral Shares (VTSAX), which has a 0.14% expense ratio, posted a 10-year gain of 9.73% and YTD loss of 24.12%, data show.

“Financial advisors should not view these as low vol, or safe investments, per se,” Chang warns. “As recently as this month, we had [some of the best performers] drop over 20% in less than two weeks and dramatically underperform the S&P during those times.”

Fees are cheaper than the broader fund industry. At an average of 30 basis points, the top performers carry fees well below the 0.48% investors paid on average, according to Morningstar’s most recent annual fee survey, which reviewed the asset-weighted average expense ratios of all U.S. open-end mutual funds and ETFs.

“It is critical that investors stay invested during these times,” Chang says. “As an advisor, making tactical moves that position the portfolio in the unprecedented market presented by COVID-19 can really show clients that one is not burying their head in the sand.”

Scroll through to see the 20 fixed-income funds ranked by their 10-year returns through March 24. Funds with less than $500 million in assets under management and investment minimums over $100,000 were excluded, as were leveraged and institutional funds. Assets and expense ratios are listed for each, as well as year-to-date, one-, three- and five-year returns. The data show each fund's primary share class. All data from Morningstar Direct.

FP32620_20.png

Western Asset SMASh Series EC (LMECX)

1-Yr. Return: -10.00%
3-Yr. Annualized Return: -0.47%
5-Yr. Annualized Return: 1.59%
FP32620_19.png

Western Asset SMASh SEries M (LMSMX)

1-Yr. Return: 5.38%
3-Yr. Annualized Return: 4.73%
5-Yr. Annualized Return: 4.51%
FP32620_18.png

Invesco Oppenheimer Rochester California Municipal A (OPCAX)

1-Yr. Return: -3.04%
3-Yr. Annualized Return: 2.65%
5-Yr. Annualized Return: 3.43%
FP32620_17.png

Nuveen High Yield Municipal Bond I (NHMRX)

1-Yr. Return: -10.54%
3-Yr. Annualized Return: 1.20%
5-Yr. Annualized Return: 2.24%
FP32620_16.png

iShares Long-Term Corporate Bond ETF (IGLB)

1-Yr. Return: 0.41%
3-Yr. Annualized Return: 3.18%
5-Yr. Annualized Return: 2.40%
FP32620_15.png

Invesco Oppenheimer Rochester High-Yield Municipal A (ORNAX)

1-Yr. Return: -5.37%
3-Yr. Annualized Return: 3.11%
5-Yr. Annualized Return: 4.67%
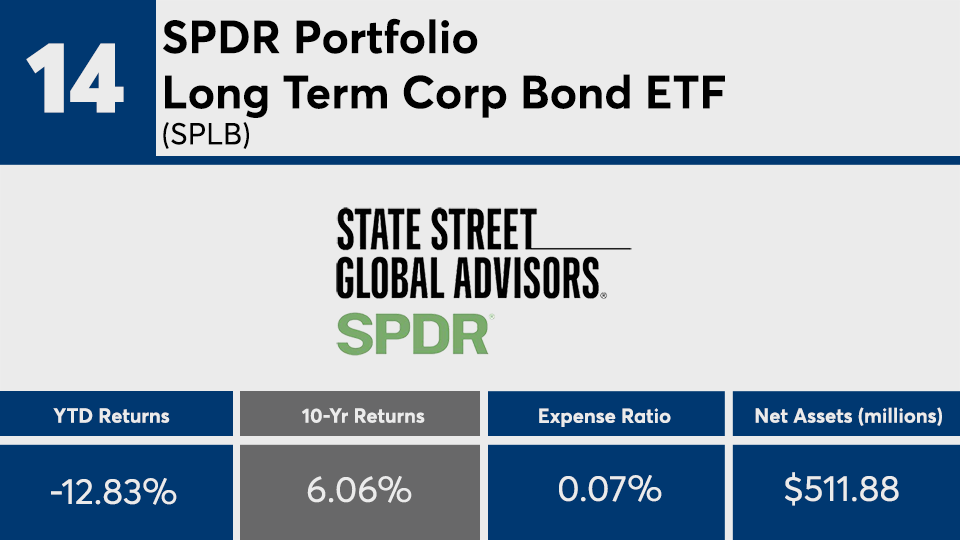
FP32620_14.png

SPDR Portfolio Long Term Corp Bond ETF (SPLB)

1-Yr. Return: 0.98%
3-Yr. Annualized Return: 3.37%
5-Yr. Annualized Return: 2.62%
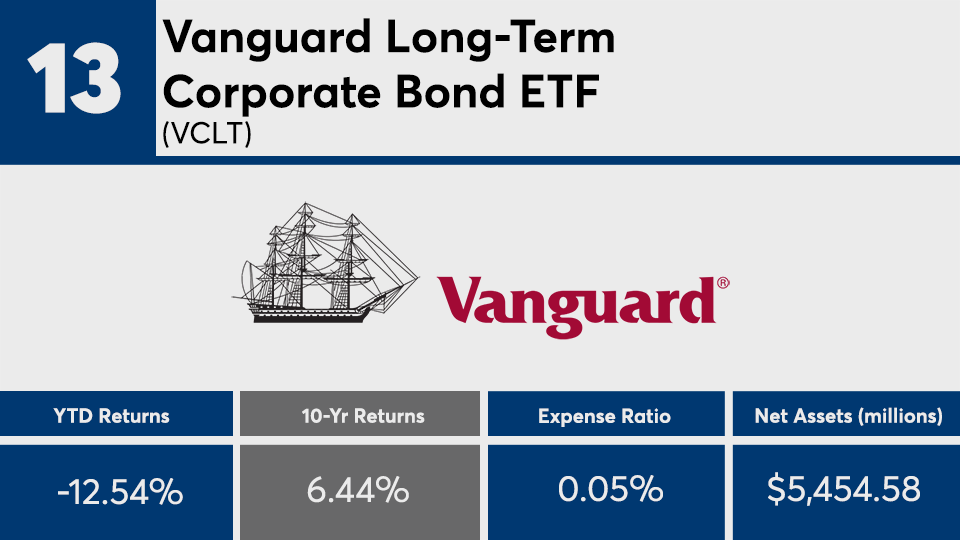
FP32620_13.png

Vanguard Long-Term Corporate Bond ETF (VCLT)

1-Yr. Return: 1.00%
3-Yr. Annualized Return: 3.48%
5-Yr. Annualized Return: 2.67%
FP32620_12.png

Invesco Oppenheimer Rochester AMT-Free Municipal A (OPTAX)

1-Yr. Return: 0.22%
3-Yr. Annualized Return: 4.26%
5-Yr. Annualized Return: 4.74%
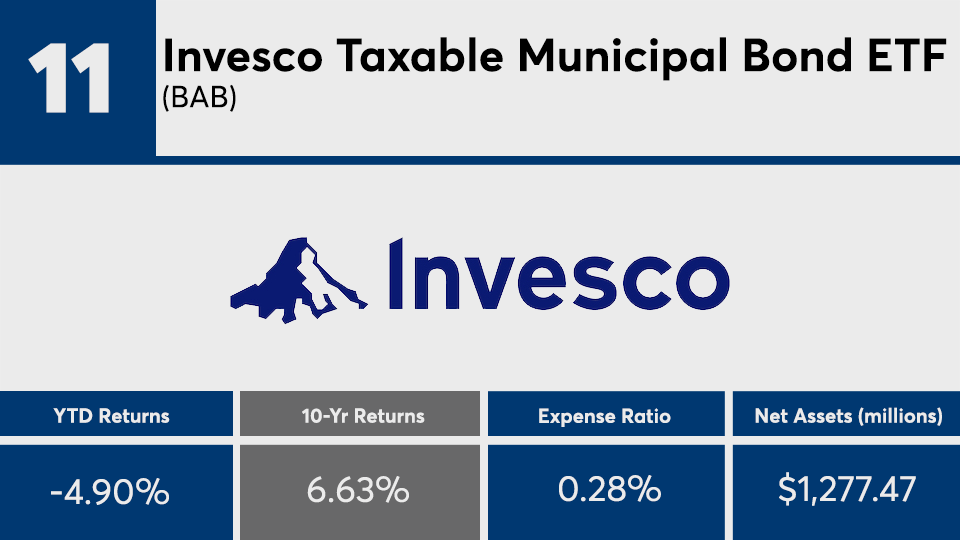
FP32620_11.png

Invesco Taxable Municipal Bond ETF (BAB)

1-Yr. Return: 2.45%
3-Yr. Annualized Return: 4.34%
5-Yr. Annualized Return: 3.56%
10-Yr. Annualized Return: 6.060
FP32620_10.png

iShares 10-20 Year Treasury Bond ETF (TLH)

1-Yr. Return: 24.48%
3-Yr. Annualized Return: 9.62%
5-Yr. Annualized Return: 5.71%
10-Yr. Annualized Return: 6.064
FP32620_9.png

Vanguard Long-Term Investment-Grade Admiral (VWETX)

1-Yr. Return: 6.20%
3-Yr. Annualized Return: 5.35%
5-Yr. Annualized Return: 3.78%
FP32620_8.png

Vanguard Long-Term Bond ETF (BLV)

1-Yr. Return: 14.38%
3-Yr. Annualized Return: 7.78%
5-Yr. Annualized Return: 4.66%
FP32620_7.png

SEI Long Duration A (SIIT) (LDRAX)

1-Yr. Return: 11.63%
3-Yr. Annualized Return: 7.07%
5-Yr. Annualized Return: 4.56%
FP32620_6.png

T. Rowe Price US Treasury Long-Term (PRULX)

1-Yr. Return: 32.66%
3-Yr. Annualized Return: 12.77%
5-Yr. Annualized Return: 6.50%
FP32620_5.png

Vanguard Long-Term Treasury Admiral (VUSUX)

1-Yr. Return: 31.83%
3-Yr. Annualized Return: 12.67%
5-Yr. Annualized Return: 6.64%
FP32620_4.png

Vanguard Long-Term Treasury ETF (VGLT)

1-Yr. Return: 31.82%
3-Yr. Annualized Return: 12.75%
5-Yr. Annualized Return: 6.71%
FP32620_3.png

SPDR Portfolio Long Term Treasury ETF (SPTL)

1-Yr. Return: 33.97%
3-Yr. Annualized Return: 13.20%
5-Yr. Annualized Return: 6.94%
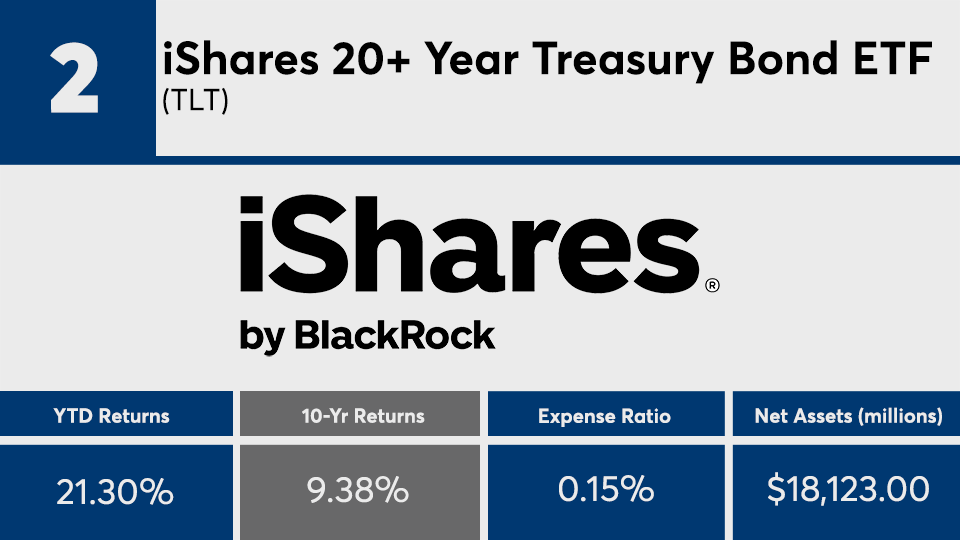
FP32620_2.png

iShares 20+ Year Treasury Bond ETF (TLT)

1-Yr. Return: 34.87%
3-Yr. Annualized Return: 13.52%
5-Yr. Annualized Return: 7.02%
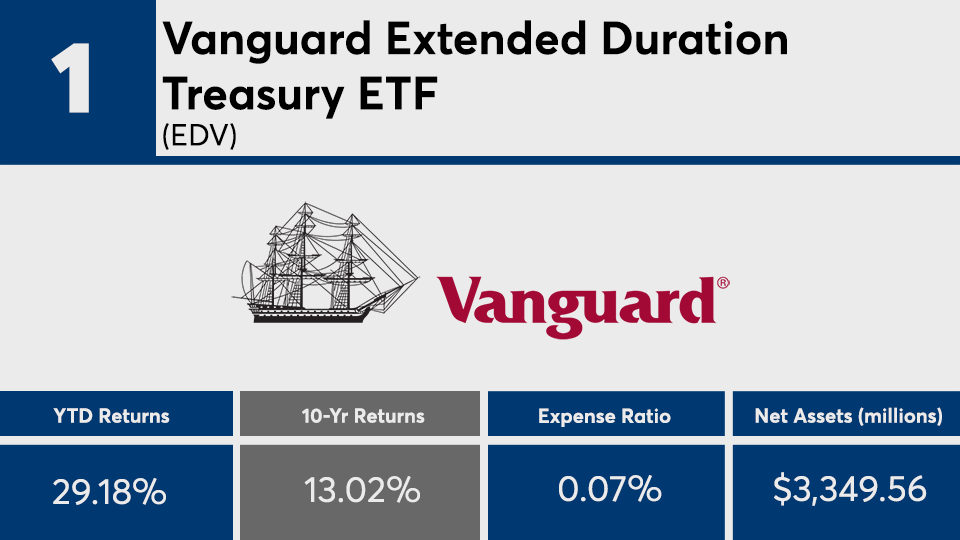
FP32620_1.png

Vanguard Extended Duration Treasury ETF (EDV)

1-Yr. Return: 47.60%
3-Yr. Annualized Return: 18.19%
5-Yr. Annualized Return: 8.76%
MORE FROM FINANCIAL PLANNING