And while a healthier economy is putting more money in consumers' pockets, house price appreciation is outpacing income and wage growth. Increases in mortgage rates are also creating even more affordability challenges for house hunters.
Advisors with
Although home prices in some cities have remained steady or even declined from a year ago, real home prices in markets like San Jose, California, have shot up nearly 20%, according to a First American Financial analysis of home values that factors in local wages and mortgage rates in large cities.
On average, real house prices grew 8.8% annually in April, but areas like Las Vegas saw nearly double the national trend, with home prices increasing over 15%. The nation's RHPI is up 0.5% from March.
With the overall housing market plagued by a shortage of supply, demand for housing continues putting upward pressure on house values at a time when mortgage rates are also rising. This paves the way for dwindling purchasing power in some of the country's hottest housing markets.
Here's a look at 12 housing markets where homebuyer purchasing power is plunging.
The data, from the First American Real House Price Index, measures home price changes, taking local wages and mortgage rates into account "to better reflect consumers' purchasing power and capture the true cost of housing," according to the First American report.
The "house buying power" reflects the price a typical buyer in that market can afford, based on local wages and interest rates. The April 2018 data is ranked by RHPI value, where a reading of 100 is equal to conditions in January 2000.

No. 12 Atlanta
RHPI: 76.1
Year-over-year RHPI: 8.56%

No. 11 Boston
RHPI: 88.83
Year-over-year RHPI: 9.36%

No. 10 Columbus, Ohio
RHPI: 61.52
Year-over-year RHPI: 9.76%

No. 9 Orlando, Florida
RHPI: 94.21
Year-over-year RHPI: 9.81%

No. 8 Minneapolis
RHPI: 91.07
Year-over-year RHPI: 9.86%

No. 7 Tampa, Florida
RHPI: 76.17
Year-over-year RHPI: 9.96%

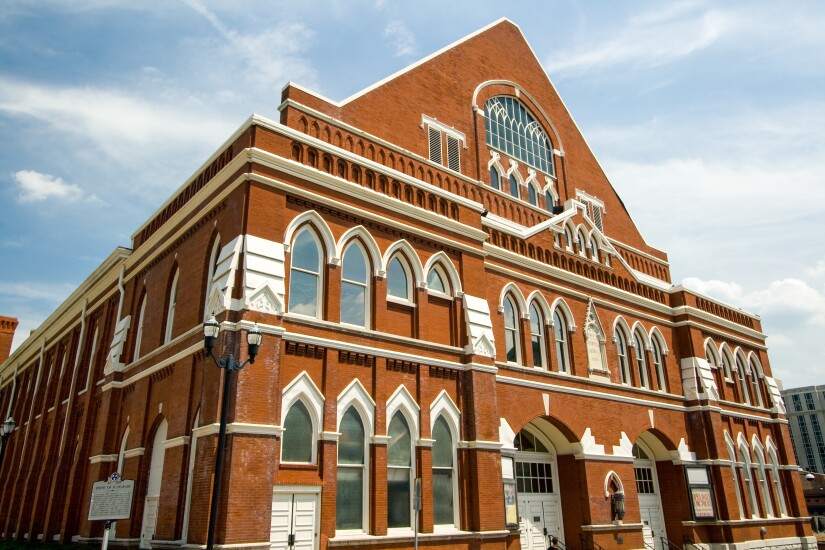
No. 6 Nashville, Tennesse
RHPI: 105.42
Year-over-year RHPI: 10.61%

No. 5 Charlotte, North Carolina
RHPI: 75.23
Year-over-year RHPI: 10.66%

No. 4 Jacksonville, Florida
RHPI: 97.39
Year-over-year RHPI: 11.13%

No. 3 Seattle
RHPI: 96.19
Year-over-year RHPI: 12.24%

No. 2 Las Vegas
RHPI: 86.47
Year-over-year RHPI: 15.07%

No. 1 San Jose, California
RHPI: 143.75
Year-over-year RHPI: 19.27


