10 ETF Winners That May Be Too Hot to Handle
This list of top 10 in ETFland looks different every week, says Ben Johnson, director of global ETF research at Morningstar. Its not a very useful list as far as advisors are concerned."
Reviewing the list Johnson says, "These are all products that represent ways to access leverage or a short exposure to the hottest or coldest segment of the global market over the past few months. In particular, he adds, China has been on a tear and Russia bounced strongly off the bottom.
But ultimately, advisors should bet on broad low-cost, broad exposures -- none of which are featured on this list, he argues. While clients may want to chase high gains, Johnson says advisors should be looking for funds with stability instead of one "good" day. He warns advisors that these funds fluctuate not only on a weekly basis, but a daily one. --Andrew Pavia
All data from Morningstar as of March 31, 2015. Scroll through to view the hottest ETFs of Q1 or click here to view this list in a single-page version.
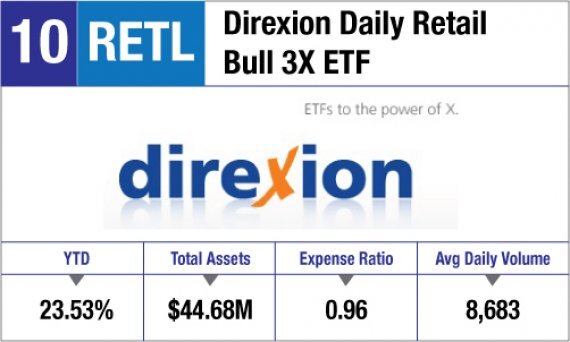
10. Direxion Daily Retail Bull 3X ETF
YTD: 23.53%
Total Assets: $44.68M
Expense Ratio: 0.96
Avg Daily Volume: 8,683

9. ProShares Ultra Euro
YTD: 24.71%
Total Assets: $572.66M
Expense Ratio: 0.93
Avg Daily Volume: 974,677
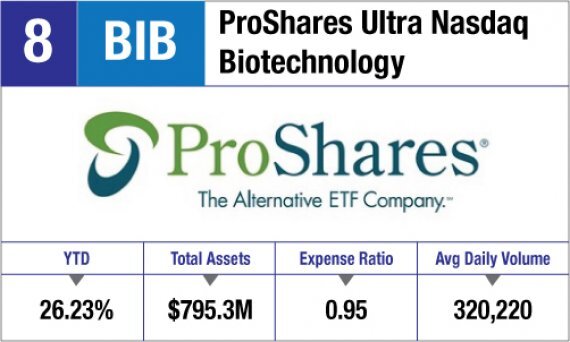
8. ProShares Ultra Nasdaq Biotechnology
YTD: 26.23%
Total Assets: $795.3M
Expense Ratio: 0.95
Avg Daily Volume: 320,220

7. Market Vector Double Short Euro ETN
YTD: 26.47%
Total Assets: $59.52M
Expense Ratio: 0.65
Avg Daily Volume: 12,239
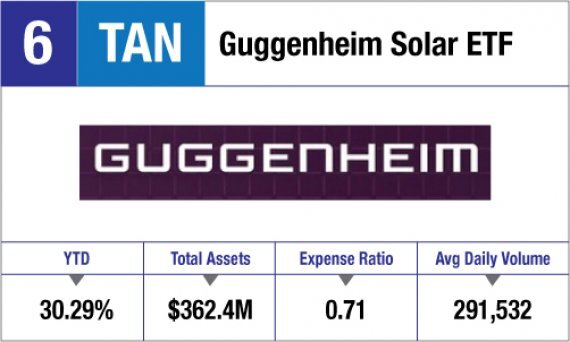
6.Guggenheim Solar ETF
YTD: 30.29%
Total Assets: $362.4M
Expense Ratio: 0.71
Avg Daily Volume: 291,532
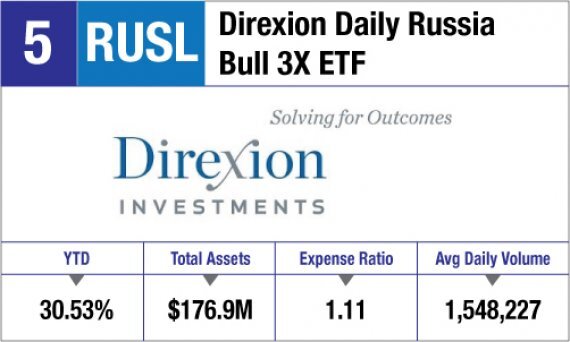
5. Direxion Daily Russia Bull 3X ETF
YTD: 30.53%
Total Assets: $176.9M
Expense Ratio: 1.11
Avg Daily Volume: 1,548,227
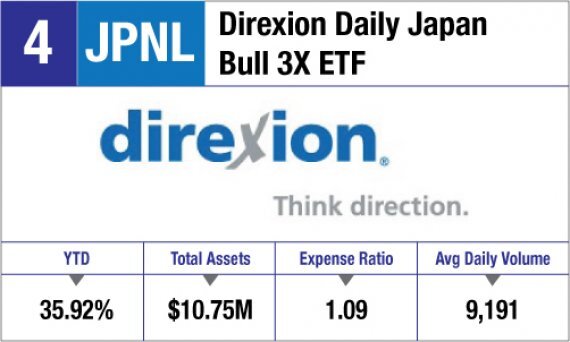
4. Direxion Daily Japan Bull 3X ETF
YTD: 35.92%
Total Assets: $10.75M
Expense Ratio: 1.09
Avg Daily Volume: 9,191
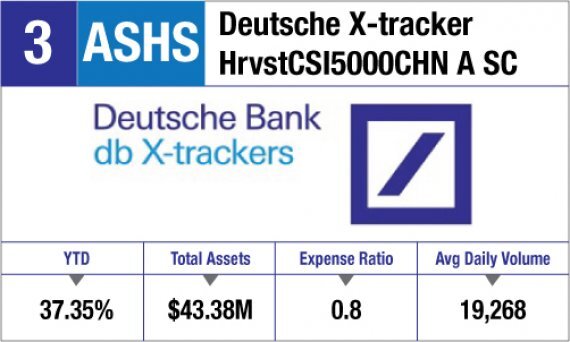
3. Deutsche X-tracker HrvstCSI5000CHN A SC
YTD: 37.35%
Total Assets: $43.38M
Expense Ratio: 0.8
Avg Daily Volume: 19,268

2. DB Crude Oil Double Short ETN
YTD: 37.87%
Total Assets: $58.57M
Expense Ratio: 0.75
Avg Daily Volume: 126,449

1. Market Vector ChinaAMC SME-ChiNext ETF
YTD: 48.56%
Total Assets: $44.41M
Expense Ratio: 0.68
Avg Daily Volume: 14,585


