Funds with the best 15-year returns

Solid management and an attractive sector are some of the key characteristics of the funds with over a decade of continued outperformance. Another feature? High fees.

The 20 funds with the largest gains of the last 15 years notched an average return of more than 17%, Morningstar Direct data show. In the last year, the same funds returned over 76%.

Deeper analysis of the top 20 funds in this ranking depicts a time when large-cap technology has dominated investor attention, says Bryan Shipley, co-CEO and chief investment officer at Arnerich Massena.

“While these funds have managed to add alpha via stock selection, the primary reason for their strong absolute performance is most likely due to the benefit from the massive tailwind of investors’ strong demand for large cap technology companies,” Shipley says. “Large-cap companies have significantly outperformed small cap companies and growth has significantly outperformed value during this time period.”

Compared with the broader fund industry, index trackers such as SPDR S&P 500 ETF Trust (SPY) and the SPDR Dow Jones Industrial Average ETF Trust (DIA) delivered 15-year annualized gains of 9.86% and 9.77%, respectively, data show. Over the last year, SPY and DIA had returns of 18.24% and 10.44%, respectively.

In bonds, the iShares Core U.S. Aggregate Bond ETF (AGG) recorded gains of 3.71% and 4.26% over the one- and 15-year periods, data show.

"The big focus in technology during the past 12 years, and even the three years prior during the financial crisis should be considered the principal driver, and so thinking about the outlook for technology companies will be a key consideration in how these funds perform going forward," adds Steven Skancke, chief economic advisor at Keel Point.

Steady 15-year gains, however, came at significantly higher price than the industry average. Carrying an average expense ratio of 123 basis points, the 20 leaders since 2006 were well above the 0.45% investors paid for fund investing in 2019, according to Morningstar’s most recent annual fee survey.

With many in this ranking actively managed by a fund manager or management team, it may be no surprise to see some with expense ratios well over 200 basis points, notes Jennifer DeSisto, chief investment officer at Anchor Capital. “The fees of these funds' relative 15% annualized returns does not look absurd,” DeSisto says. “The question, in my opinion, is whether you could get the same exposure in a technology sector ETF or even the S&P 500 for lower fees.”

For advisors with clients focused on their own long-term horizons, Shipley says it’s important to ask, “Do I expect the next 10 to 15 years to play out exactly as they did in the past cycle which led to these strong results?

“Looking at past performance as the sole deciding factor is a poor recipe for identifying potential future outperformance,” Shipley says, noting that it’s also important discuss “qualitative factors like the stability of the firm and underlying investment team, structure of the portfolio, investment manager style, and what your expectations are for what the future might look like.”

Scroll through to see the 20 funds, with more than $100 million in AUM, and the biggest 15-year annualized gains. Assets and average expense ratios, as well as year-to-date, one-, three-, five and 10-year returns through Feb. 18 are also listed for each. The data show each fund's primary share class and current portfolio manager or managers. All data is from Morningstar Direct.

FP022121_20 copy.png

Fidelity OTC (FOCPX)

YTD Return: 8.16%
3-Yr. Annualized Return: 26.4%
5-Yr. Annualized Return: 29.83%
10-Yr. Annualized Return: 19.15%
Inception Date: Dec. 31, 1984
FP022121_19 copy.png

Virtus AllianzGI Technology A (RAGTX)

YTD Return: 10.17%
3-Yr. Annualized Return: 32.65%
5-Yr. Annualized Return: 33.95%
10-Yr. Annualized Return: 19.35%
Minimum Initial Investment: $2,500
Front Load: 5.5%
Inception Date: Feb. 5, 2002
FP022121_18 copy.png

Janus Henderson Global Technology and Innovation D (JNGTX)

YTD Return: 8.11
3-Yr. Annualized Return: 30.91
5-Yr. Annualized Return: 35.02
10-Yr. Annualized Return: 19.96
Minimum Initial Investment: $2,500
Inception Date: Dec. 31, 1998
FP022121_17 copy.png

Columbia Seligman Communications & Information A (SLMCX)

YTD Return: 12.61%
3-Yr. Annualized Return: 30.38%
5-Yr. Annualized Return: 31.54%
10-Yr. Annualized Return: 18.95%
Minimum Initial Investment: $2,000
Front Load: 5.75%
Inception Date: June 23, 1983
FP022121_16 copy.png

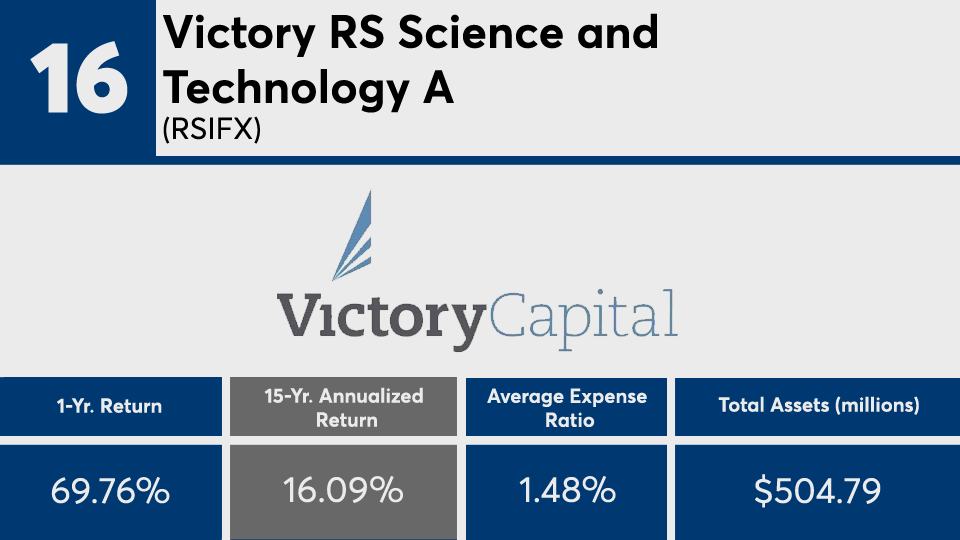
Victory RS Science and Technology A (RSIFX)

YTD Return: 12.38
3-Yr. Annualized Return: 33.58
5-Yr. Annualized Return: 38.28
10-Yr. Annualized Return: 19.37
Minimum Initial Investment: $2,500
Front Load: 5.75%
Inception Date: Nov. 15, 1995
FP022121_15 copy.png

Wells Fargo Specialized Technology A (WFSTX)

YTD Return: 10.16%
3-Yr. Annualized Return: 32.75%
5-Yr. Annualized Return: 33.86%
10-Yr. Annualized Return: 19.29%
Minimum Initial Investment: $1,000
Front Load: 5.75%
Inception Date: Sept., 18, 2000
FP022121_14 copy.png

Fidelity Select Retailing (FSRPX)

YTD Return: 7.82%
3-Yr. Annualized Return: 24.21%
5-Yr. Annualized Return: 24.36%
10-Yr. Annualized Return: 20.63%
Inception Date: Dec. 16, 1985
FP022121_13 copy.png

Transamerica Capital Growth A (IALAX)

YTD Return: 14.21%
3-Yr. Annualized Return: 41.82%
5-Yr. Annualized Return: 38.68%
10-Yr. Annualized Return: 22.66%
Minimum Initial Investment: $1,000
Front Load: 5.5%
Inception Date: March 1, 1999
FP022121_12 copy.png

Fidelity Select IT Services (FBSOX)

YTD Return: 3.74%
3-Yr. Annualized Return: 23.5%
5-Yr. Annualized Return: 25.78%
10-Yr. Annualized Return: 19.51%
15-Yr. Annualized Return: 16.497%
Inception Date: Feb. 4, 1998
FP022121_11 copy.png

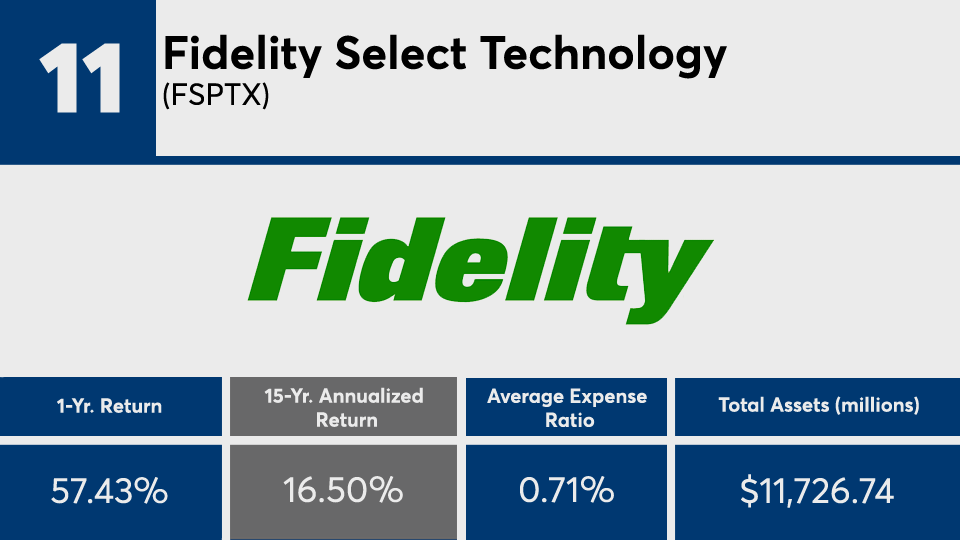
Fidelity Select Technology (FSPTX)

YTD Return: 7.67%
3-Yr. Annualized Return: 31.38%
5-Yr. Annualized Return: 35.6%
10-Yr. Annualized Return: 19.93%
15-Yr. Annualized Return: 16.502%
Inception Date: July 14, 1981
FP022121_10 copy.png

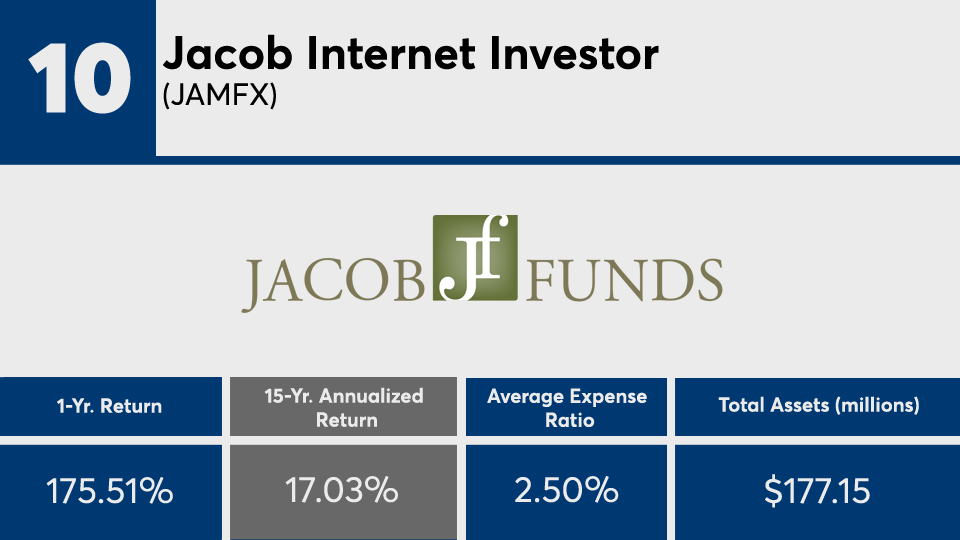
Jacob Internet Investor (JAMFX)

YTD Return: 39.38%
3-Yr. Annualized Return: 53.54%
5-Yr. Annualized Return: 44.5%
10-Yr. Annualized Return: 22.86%
Minimum Initial Investment: $2,500
Redemption Load: 2%
Inception Date: Dec. 13, 1999
FP022121_9 copy.png

Baron Partners Retail (BPTRX)

YTD Return: 12.29%
3-Yr. Annualized Return: 55.08%
5-Yr. Annualized Return: 45.37%
10-Yr. Annualized Return: 24.3%
Minimum Initial Investment: $2,000
Inception Date: April, 30, 2003
FP022121_8 copy.png

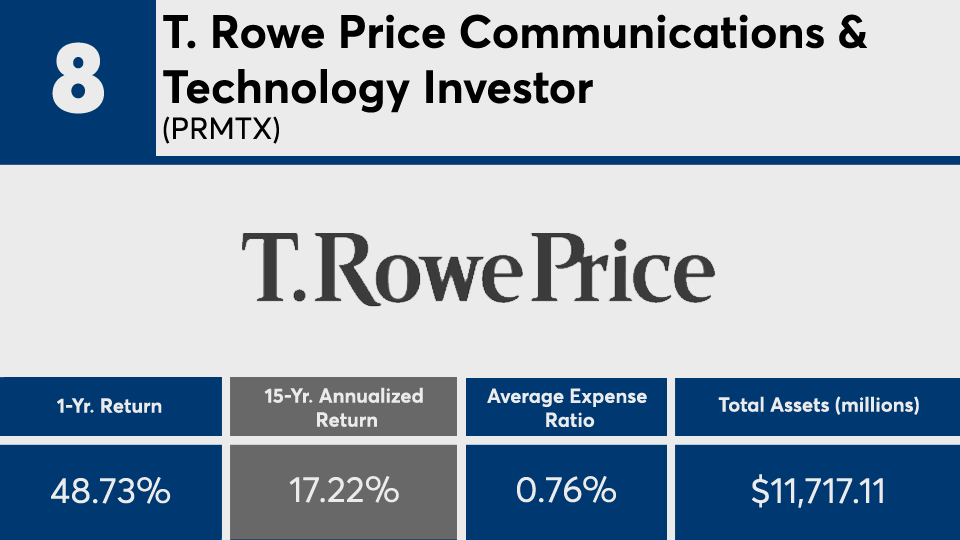
T. Rowe Price Communications & Technology Investor (PRMTX)

YTD Return: 8.06%
3-Yr. Annualized Return: 27.27%
5-Yr. Annualized Return: 28.02%
10-Yr. Annualized Return: 19.13%
Minimum Initial Investment: $2,500
Inception Date: Oct. 13, 1993
FP022121_7 copy.png

BlackRock Technology Opportunities Investor A (BGSAX)

YTD Return: 11.91%
3-Yr. Annualized Return: 41.32%
5-Yr. Annualized Return: 41.34%
10-Yr. Annualized Return: 22.29%
Minimum Initial Investment: $1,000
Front Load: 5.25%
Inception Date: May 15, 2000
FP022121_6 copy.png

Virtus Zevenbergen Innovative Growth Stock I (SCATX)

YTD Return: 13.17%
3-Yr. Annualized Return: 50.41%
5-Yr. Annualized Return: 43.21%
10-Yr. Annualized Return: 22.69%
Minimum Initial Investment: $100,000
Inception Date: Feb. 23, 2004
FP022121_5 copy.png

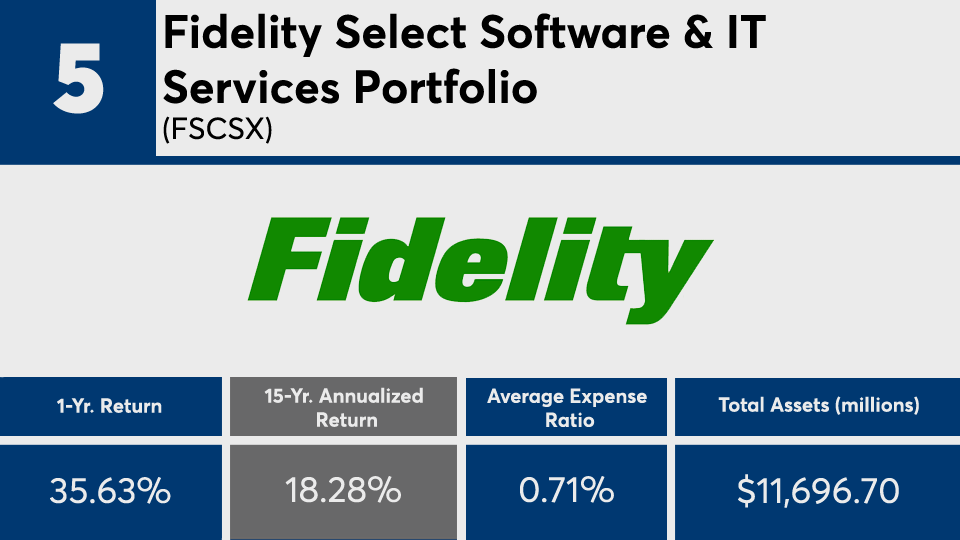
Fidelity Select Software & IT Services Portfolio (FSCSX)

YTD Return: 5.68%
3-Yr. Annualized Return: 27.67%
5-Yr. Annualized Return: 30.49%
10-Yr. Annualized Return: 21.25%
Inception Date: July 29, 1985
FP022121_4 copy.png

Morgan Stanley Insight A (CPOAX)

YTD Return: 18.8%
3-Yr. Annualized Return: 52.12%
5-Yr. Annualized Return: 45.35%
10-Yr. Annualized Return: 24.7%
Minimum Initial Investment: $1,000
Front Load: 5.25%
Inception Date:
FP022121_3 copy.png

Berkshire Focus (BFOCX)

YTD Return: 10.24%
3-Yr. Annualized Return: 42.52%
5-Yr. Annualized Return: 41.21%
10-Yr. Annualized Return: 22.43%
Minimum Initial Investment: $5,000
Redemption Load: 2%
Inception Date: July 1, 1997
FP022121_2 copy.png

Firsthand Technology Opportunities (TEFQX)

YTD Return: 16.44%
3-Yr. Annualized Return: 41.52%
5-Yr. Annualized Return: 43.45%
10-Yr. Annualized Return: 21.88%
Minimum Initial Investment: $2,000
Inception Date: Sept. 30, 1999
FP022121_1 copy.png

T. Rowe Price Global Technology (PRGTX)

YTD Return: 14.24%
3-Yr. Annualized Return: 31.08%
5-Yr. Annualized Return: 35.4%
10-Yr. Annualized Return: 23.68%
Minimum Initial Investment: $2,500
Inception Date: Sept. 29, 2000
MORE FROM FINANCIAL PLANNING