An analysis of the industry's worst-performing index funds over five years presents a costly lesson in diversification: those with the biggest losses had a majority of their holdings in sectors with the poorest returns.
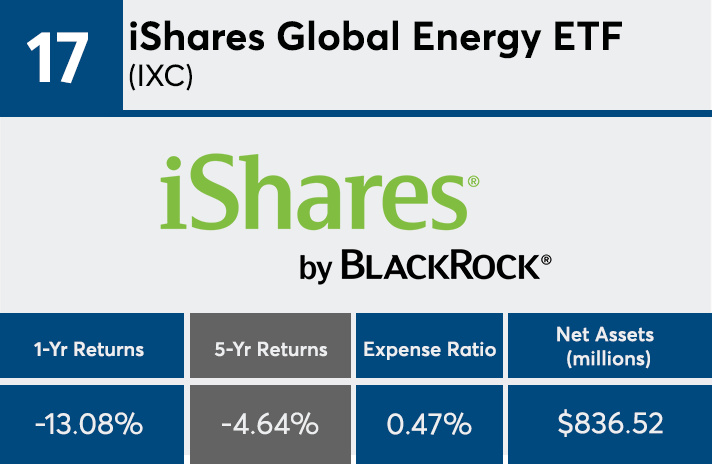
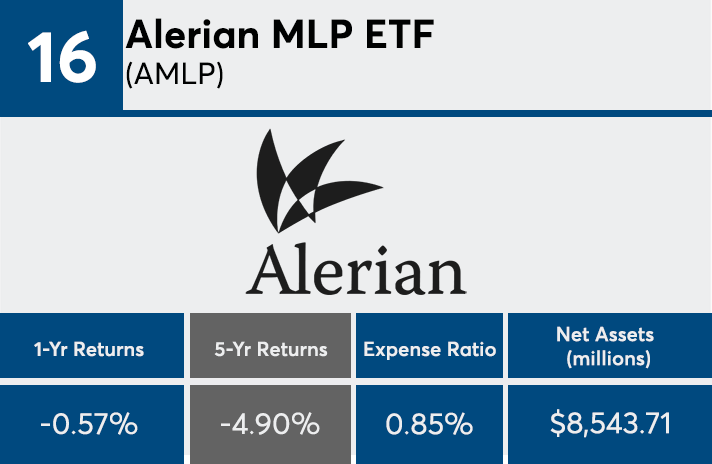
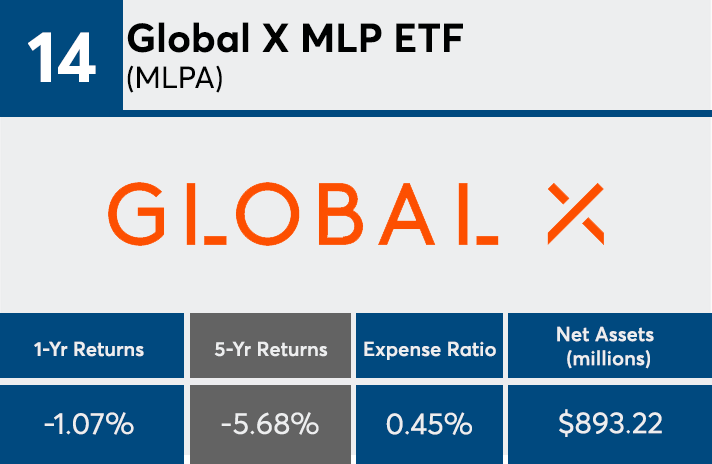
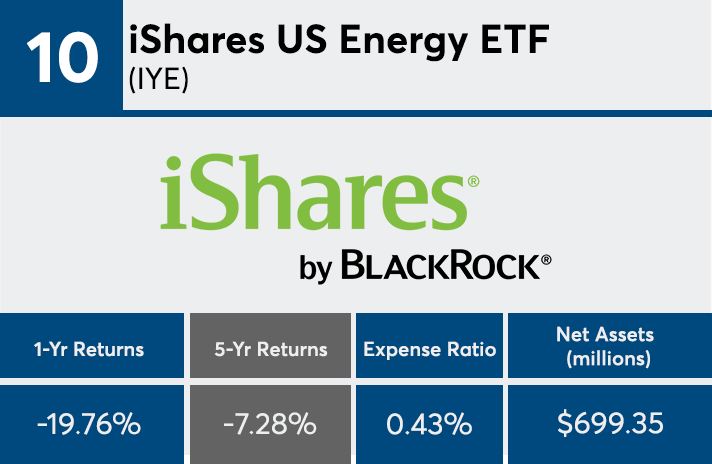
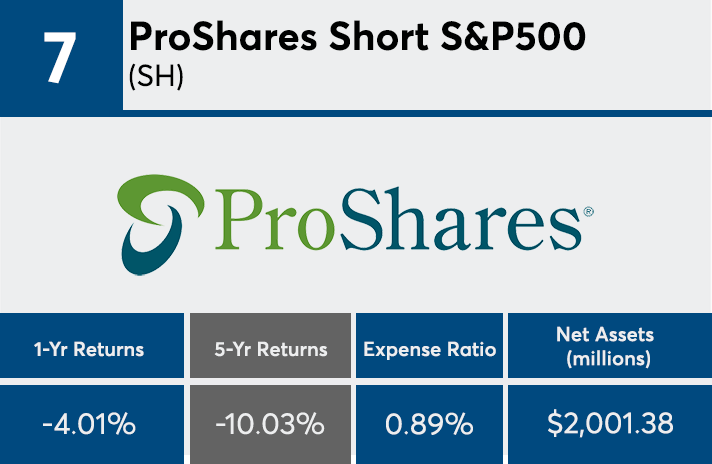
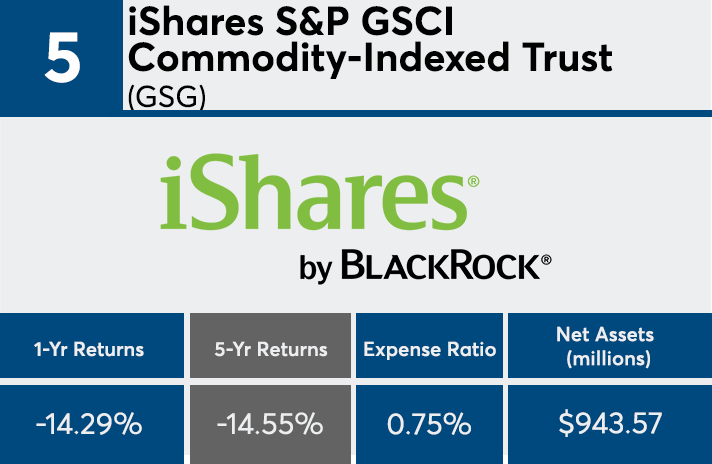
With more than $44 billion in combined assets under management, the 20 passively managed products with the worst five-year returns had an average loss of 9.51%, Morningstar Direct data show. Of those funds — all ETFs — 15 are in energy and commodity sector investments, two are short ETFs, one invests in Mexico, another in Spain, and the remaining are in European banks, data show.
“These funds offer exposure to extremely narrow and volatile segments of the market and are best used as bit players in a diversified portfolio — if they belong at all,” says Ben Johnson, Morningstar’s director of passive fund research.
The equity energy sector posted a five-year loss of 14.4%, while the commodities broad basket sector had a loss of 9.24% over the same period, Morningstar data show. Bear market funds was the only other category that performed worse, with a loss of 15.96%.
“Beneficiaries of stronger than expected global growth leading to inflation lost out,” says Scott Kubie, senior investment strategist at Carson Partners. “Energy, commodities and Europe all benefit when growth gets strong and inflation becomes a risk.”
At 54 basis points, the average net expense ratio of the worst-performers was significantly higher than the 0.48% investors paid for fund investing on average last year, according to Morningstar’s most recent annual fee survey, which reviewed the asset-weighted average expense ratios of all U.S. open-end mutual funds and ETFs. With $759 billion in AUM, the industry’s largest passively managed fund, Vanguard Total Stock Market Index Fund Admiral Shares (VTSAX), had a five-year return of 9.82% and expense ratio of 0.04%.
Dave Geibel, senior vice president and managing director at Girard, says advisors must look beyond fees when helping clients build a well-diversified portfolio. “Evaluating any investment cost is certainly one of the factors to be considered when picking a fund that will mimic an index,” Geibel said. “Performance is the ultimate variable and cost in one of many factors which contributes or detracts from performance.”
Scroll through to see the 20 worst-performing passive funds ranked by their five-year annualized returns through June 7. Funds with less than $500 million in AUM and investment minimums over $100,000 were excluded, as were ETNs, leveraged and institutional funds. Assets and expense ratios for each fund, as well as one-year daily returns, are also listed. The data shows each fund's primary share class.


