Vanguard, Schwab, Fidelity top J.D. Power self-directed investor survey; Merrill Lynch and Wells Fargo at bottom

wall-street-bl112116

Do-it-yourself investors who began working with wealth managers in the pandemic era are experiencing more account problems and lower levels of customer satisfaction, according to a new J.D. Power study.

The annual J.D. Power U.S. Self-Directed Investor Satisfaction Study released this week suggests that the “honeymoon may be coming to an end” for tens of millions of new investors who sparked up business with brokerage firms over the past three years.

The study, now in its 20th year, finds that newer investors are more likely than tenured investors to butt heads with problems like website malfunctions and issues processing transactions. Nearly one in five, or 19%, of pandemic-era investors experienced problems within the past year compared to 13% of more experienced investors. 

Meanwhile, 84% of the newbies had their problems resolved compared to 92% of tenured investors.

“Pandemic-era investors who entered the financial markets during a real gold rush period of heightened expectations, significant disruption and extreme volatility represent a unique set of challenges for retail brokerage firms,” Michael Foy, senior director and head of wealth intelligence at J.D. Power, said in a statement. “First, they constitute a huge segment, which has accounted for about 25 million new accounts since 2020. They also tend to be younger, less financially secure and more apt to experience problems that are not currently being addressed effectively by their brokerage firms. 

“Right now, most firms are missing the mark when it comes to delivering the level of tailored customer experience that will help them convert this next generation of investors into loyal and profitable clients.”

The negative experiences made an impact, according to the study. Brand loyalty among pandemic-era investors is less than half that of more seasoned clients, and newer investors are more than twice as likely to switch brokerage firms than investors who’ve had their accounts for three or more years. 

“Just 24% of pandemic-era investors say they definitely will not switch providers, which is down 11 percentage points from a year ago,” according to a statement from J.D. Power. “Among more tenured investors, 50% say they definitely will not switch providers. Primary drivers of attrition risk include lack of satisfaction with products, services and tools and recommendations from friends and relatives to switch providers.”

Satisfaction scores are significantly lower among financially vulnerable clients, the study finds, suggesting firms should work on how they deliver content, tools and services that can help clients more effectively manage investments in the proper context.

Along with DIY investors, the study also tracks satisfaction among clients who interact with their firm’s financial professionals for advice despite not working with a traditional, dedicated financial advisor.

Results show that average satisfaction among this segment currently is lower than among either DIY or full-service investors, indicating that the potential of this model has not yet been fully realized.  

“With trading fees no longer being a significant revenue driver, the big opportunity for retail brokerage firms is creating loyal clients who will deepen their relationships to include revenue-generating services that address their broader financial needs for things such as advice, cash management and lending,” Foy said in a statement. “Right now, that’s precisely where many firms are dropping the ball. They are struggling to meet their clients where they are at this point in their lives and deliver the type of personalized advice, educational tools and problem-free experiences they need to grow with their firms.”

J.D. Power spoke with 4,888 investors between November and January to compile the firms’ satisfaction scores and rankings. Each of the investors said they make all their investment decisions without the counsel of a full-service dedicated financial advisor.

To get a “satisfaction index” for each wealth manager on a 1,000-point scale, J.D. Power used seven weighted factors: “trust; digital channels; the ability to manage wealth how and when I want; products and services; value for fees; people; and problem resolution.”

To see this year’s rankings for both DIY investors followed by the rankings for investors seeking guidance, scroll down our slideshows.

12. Wells Fargo

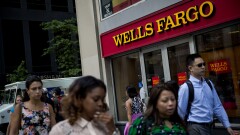
Wells Fargo V3 by Bloomberg News
2022 ranking: 12
2021 ranking: N/A
2022 score (on 1,000-point scale): 653
2021 score: N/A
2022 vs. 2021: N/A

11. Merrill Edge

Merrill-Lynch-sign-Bloomberg-News
2022 ranking: 11
2021 ranking: 9
2022 score (on 1,000-point scale): 679
2021 score: 662
2022 vs. 2021: 17

10. You Invest by J.P. Morgan

JPMorgan 2 by bloomberg
2022 ranking: 10
2021 ranking: N/A
2022 score (on 1,000-point scale): 685
2021 score: N/A
2022 vs. 2021: N/A

9. Robinhood

The Robinhood application is displayed in the App Store on an Apple Inc. iPhone in an arranged photograph taken in Washington, D.C., U.S., on Friday, Dec. 14, 2018. The Securities Investor Protection Corp. said a new checking account from Robinhood Financial LLC raises red flags and that the deposited funds may not be eligible for protection. Photographer: Andrew Harrer/Bloomberg
2022 ranking: 9
2021 ranking: 4
2022 score (on 1,000-point scale): 693
2021 score: 711
2022 vs. 2021: (18)

8. E*TRADE

p16n82p77ms5dnlqoab1fad3gj9.jpg
2022 ranking: 8
2021 ranking: 8
2022 score (on 1,000-point scale): 708
2021 score: 692
2022 vs. 2021: 16

7. Stash

Stash-invest-logo.webp
2022 ranking: 7
2021 ranking: N/A
2022 score (on 1,000-point scale): 718
2021 score: N/A
2022 vs. 2021: N/A

6. Average industry score

2022 industry average score (on 1,000-point scale): 720
2021 industry average score: 708
2021 vs. 2020: 12
Firm with largest increase: Fidelity - 23
Firm with largest decrease: Robinhood - (18)

5. T. Rowe Price

t-rowe-price_416x416.jpg
2022 ranking: 5
2021 ranking: 3
2022 score (on 1,000-point scale): 724
2021 score: 721
2022 vs. 2021: 3

4. TD Ameritrade

TD Ameritrade building photo Bloomberg News
2022 ranking: 4
2021 ranking: 7
2022 score (on 1,000-point scale): 725
2021 score: 707
2022 vs. 2021: 18

3. Fidelity

fidelity2
2022 ranking: 3
2021 ranking: 6
2022 score (on 1,000-point scale): 730
2021 score: 707
2022 vs. 2021: 23

2. Charles Schwab

Charles-Schwab-window-Bloomberg-News
2022 ranking: 2
2021 ranking: 2
2022 score (on 1,000-point scale): 735
2021 score: 727
2022 vs. 2021: 8

1. Vanguard

vanguard-real-estate-logo
Suitable for use in public relations materials
Lisa J Godfrey
2022 ranking: 1
2021 ranking: 1
2022 score (on 1,000-point scale): 736
2021 score: 736
2022 vs. 2021: -

10. Merrill Edge

merrill.jpg
2022 ranking: 10
2021 ranking: 9
2022 score (on 1,000-point scale): 649
2021 score: 664
2022 vs. 2021: (15)

9. Wells Fargo

Wells Fargo people walking by Bloomberg News
2022 ranking: 9
2021 ranking: 10
2022 score (on 1,000-point scale): 654
2021 score: 616
2022 vs. 2021: 38

8. E*TRADE

p16n82p77ms5dnlqoab1fad3gj9.jpg
2022 ranking: 8
2021 ranking: 7
2022 score (on 1,000-point scale): 696
2021 score: 674
2022 vs. 2021: 22

7. J.P. Morgan Investments with Chase

Signage stands on display outside the JPMorgan & Chase Tower in downtown Chicago, Illinois, U.S., on Saturday, Oct. 7, 2017. AKA J.P. Morgan.
2022 ranking: 7
2021 ranking: 8
2022 score (on 1,000-point scale): 702
2021 score: 671
2022 vs. 2021: 31

6. Average industry score

2022 industry average score (on 1,000-point scale): 708
2021 industry average score: 692
2021 vs. 2020: 16
Firm with largest increase: T. Rowe Price - 66
Firm with largest decrease: Vanguard and Merrill Edge - (15)

5. Fidelity

fidelity2
2022 ranking: 5
2021 ranking: 4
2022 score (on 1,000-point scale): 711
2021 score: 696
2022 vs. 2021: 15

4. TD Ameritrade

TD Ameritrade building photo Bloomberg News
2022 ranking: 4
2021 ranking: 6
2022 score (on 1,000-point scale): 717
2021 score: 684
2022 vs. 2021: 33

3. Charles Schwab

Charles-Schwab-060518
2022 ranking: 3
2021 ranking: 3
2022 score (on 1,000-point scale): 719
2021 score: 702
2022 vs. 2021: 17

2. Vanguard

vanguard-real-estate-logo
2022 ranking: 2
2021 ranking: 1
2022 score (on 1,000-point scale): 721
2021 score: 736
2022 vs. 2021: (15)

1. T. Rowe Price

t-rowe-price_416x416.jpg
2022 ranking: 1
2021 ranking: 2
2022 score (on 1,000-point scale): 768
2021 score: 705
2022 vs. 2021: 63
MORE FROM FINANCIAL PLANNING