Bond funds with the biggest net flows YTD

With markets currently shaped by fear and uncertainty during the coronavirus pandemic, flows in the fixed-income fund world have largely shifted to short-term Treasury ETFs. But will that strategy work for clients’ long-term goals?

The 20 bond funds with the largest net flows — and at least $500 million in assets under management — have raked in a combined $41.2 billion in the first quarter, Morningstar Direct data show. The average gain among those funds — mostly ETFs — barely broke 1.5%, over the same period, data show. That comes in below the Bloomberg Barclays US Aggregate Bond Index’s 2.97% return this year, as measured by the iShares Core US Aggregate Bond ETF (AGG).

Marc Pfeffer, CIO at CLS Investments, says investors’ desperate search for temporary security is one reason behind the shift, noting the move could prove challenging when looked at through a long-term lens.

“Six of the 10 top funds that received flows this year were Treasury funds in one shape or form,” Pfeffer says. “We saw that also in the fourth quarter of 2018 when stocks got crushed. What’s more interesting now — at least up until a month ago — is you were getting return on your cash. How will that change going forward? Are people going to hide out in a T-bill? Are they going to be accepting of zero?”

For comparison, the industry’s biggest bond fund, the $269 billion Vanguard Total Bond Market Index Admiral (VBTLX), recorded a net flow of $2.8 billion and YTD return of 3.58%, data show. Over the longer term, the fund has generated a 10-year return of 3.89%. On the equities side, the largest overall fund, the $840.9 billion Vanguard Total Stock Market Index Fund Admiral Shares (VTSAX), has a 0.14% expense ratio and has seen a net inflow of $30.5 billion with a YTD loss of 24.27% and 10-year gain of 9.58%, data show.

Fees among the bond funds with the biggest net flows of 2020 were significantly lower than the rest of the industry. At an average of 14 basis points, they are far below the 0.48% investors paid on average for fund investing last year, according to Morningstar’s most recent annual fee survey, which reviewed the asset-weighted average expense ratios of all U.S. open-end mutual funds and ETFs.

While looking at short-term flows and gains is a dangerous game for long-term investors, Pfeffer says unique times are forcing advisors and their clients to begin making unique decisions.

“Ideally, you would like clients to try not to make really short-term decisions, however this is an unprecedented situation,” Pfeffer explains. “Everyone’s situation is different. Some people can continue to focus on the long-term because their jobs and careers are intact, but many others have been thrust into a situation that they could not anticipate, whether it be illness or loss or of job. For those clients, there has to be some reallocation about their portfolios and how their risk is constructed.”

Scroll through to see the 20 fixed-income funds with the largest YTD share class net flows through April 1. Funds with less than $500 million in AUM and investment minimums over $100,000 were excluded, as were leveraged and institutional funds. Assets, expense ratios and five-year net share class flows are listed for each, as well as year-to-date, one-, three-, five- and 10-year returns. The data show each fund's primary share class. All data from Morningstar Direct.

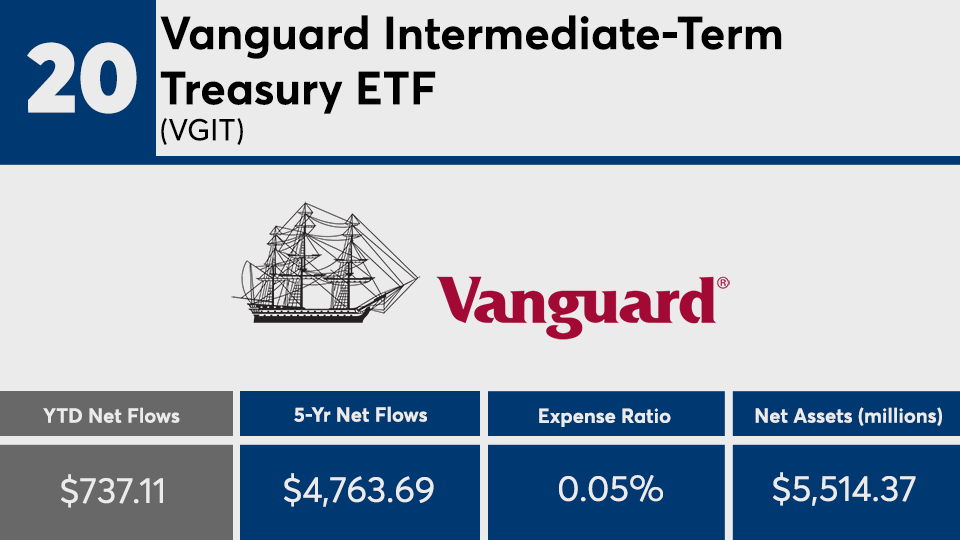
FP040620_20.png

Vanguard Intermediate-Term Treasury ETF (VGIT)

YTD Return: 7.18%
1-Yr. Return: 12.11%
3-Yr. Annualized Return: 5.19%
5-Yr. Annualized Return: 3.36%
10-Yr. Annualized Return: 3.81%
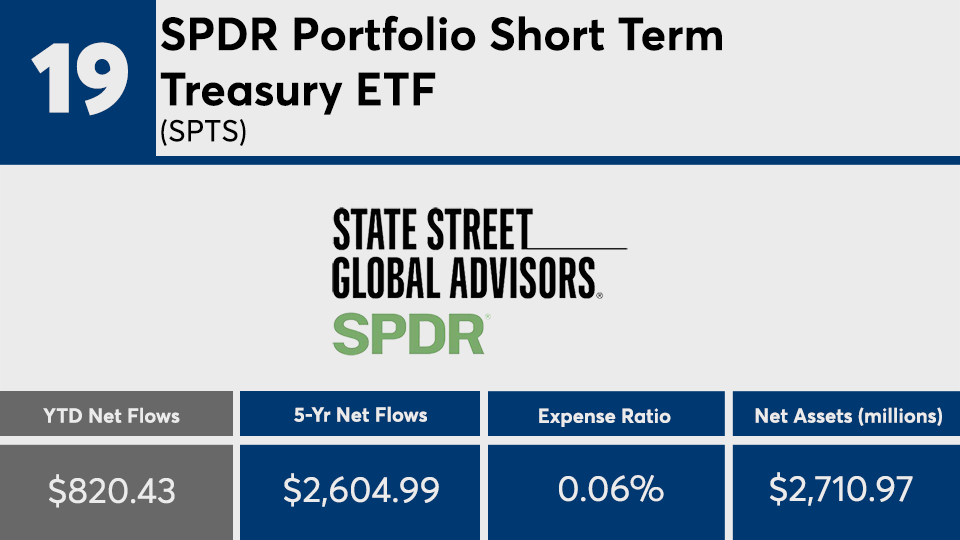
FP040620_19.png

SPDR Portfolio Short Term Treasury ETF (SPTS)

YTD Return: 2.78%
1-Yr. Return: 5.48%
3-Yr. Annualized Return: 2.53%
5-Yr. Annualized Return: 1.75%
10-Yr. Annualized Return: N/A
FP040620_18.png

Dodge & Cox Income (DODIX)

YTD Return: -1.06%
1-Yr. Return: 4.93%
3-Yr. Annualized Return: 3.74%
5-Yr. Annualized Return: 3.16%
10-Yr. Annualized Return: 4.09%
FP040620_17.png

Fidelity SAI US Treasury Bond Index (FUTBX)

YTD Return: 8.94%
1-Yr. Return: 14.21%
3-Yr. Annualized Return: 5.97%
5-Yr. Annualized Return: 3.33%
10-Yr. Annualized Return: N/A
FP040620_16.png

Fidelity US Bond Index (FXNAX)

YTD Return: 3.75%
1-Yr. Return: 9.79%
3-Yr. Annualized Return: 4.91%
5-Yr. Annualized Return: 3.33%
10-Yr. Annualized Return: N/A
FP040620_15.png

iShares 3-7 Year Treasury Bond ETF (IEI)

YTD Return: 6.36%
1-Yr. Return: 10.88%
3-Yr. Annualized Return: 4.67%
5-Yr. Annualized Return: 3.09%
10-Yr. Annualized Return: 3.38%
FP040620_14.png

PGIM Total Return Bond Z (PDBZX)

YTD Return: -2.86%
1-Yr. Return: 4.13%
3-Yr. Annualized Return: 3.88%
5-Yr. Annualized Return: 3.13%
10-Yr. Annualized Return: 4.79%
FP040620_13.png

American Funds Bond Fund of America A (ABNDX)

YTD Return: 3.78%
1-Yr. Return: 9.35%
3-Yr. Annualized Return: 4.56%
5-Yr. Annualized Return: 3.13%
10-Yr. Annualized Return: 3.82%
Load: 3.75%
FP040620_12.png

First Trust Low Duration Opportunities ETF (LMBS)

YTD Return: -0.17%
1-Yr. Return: 2.67%
3-Yr. Annualized Return: 2.20%
5-Yr. Annualized Return: 3.12%
10-Yr. Annualized Return: N/A
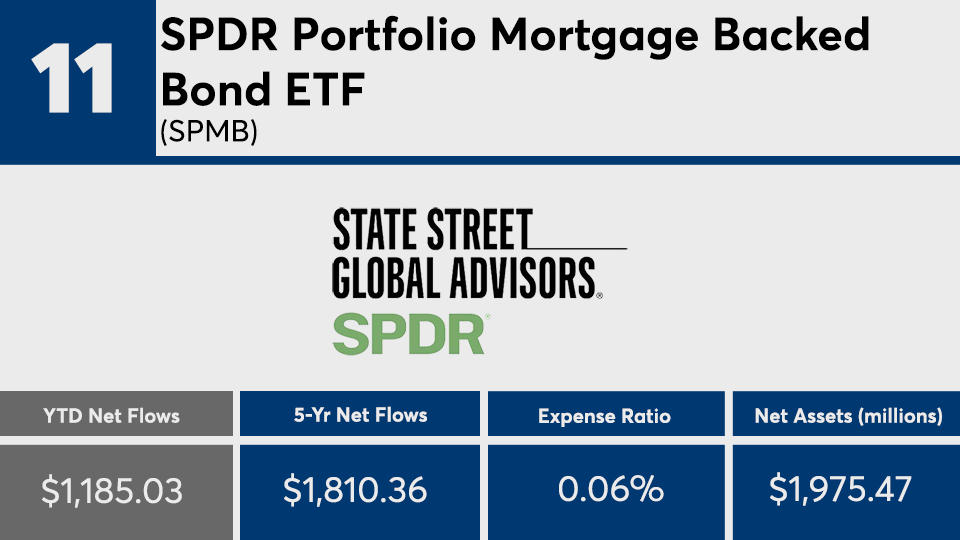
FP040620_11.png

SPDR Portfolio Mortgage Backed Bond ETF (SPMB)

YTD Return: 2.83%
1-Yr. Return: 7.21%
3-Yr. Annualized Return: 3.91%
5-Yr. Annualized Return: 2.66%
10-Yr. Annualized Return: 3.15%
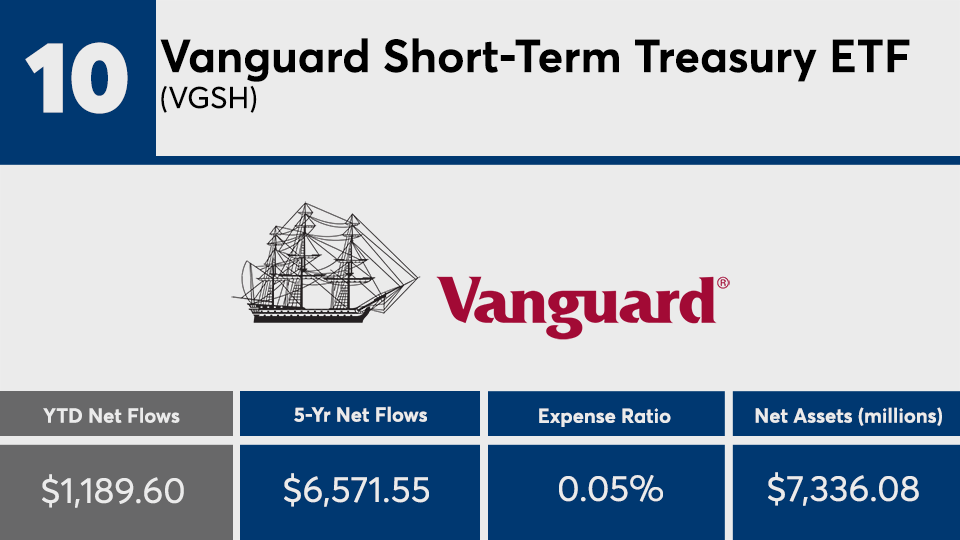
FP040620_10.png

Vanguard Short-Term Treasury ETF (VGSH)

YTD Return: 2.72%
1-Yr. Return: 5.40%
3-Yr. Annualized Return:2.62%
5-Yr. Annualized Return: 1.76%
10-Yr. Annualized Return: 1.36%
FP040620_9 copy.png

iShares Broad USD High Yield Corporate Bond ETF (USHY)

YTD Return: -14.15%
1-Yr. Return: -8.58%
3-Yr. Annualized Return: N/A
5-Yr. Annualized Return: N/A
10-Yr. Annualized Return: N/A
FP040620_8.png

Schwab Short-Term US Treasury ETF (SCHO)

YTD Return: 2.81%
1-Yr. Return: 5.51%
3-Yr. Annualized Return: 2.64%
5-Yr. Annualized Return: 1.76
10-Yr. Annualized Return: N/A
FP040620_7.png

iShares 7-10 Year Treasury Bond ETF (IEF)

YTD Return: 10.71%
1-Yr. Return: 17.39%
3-Yr. Annualized Return:7.08%
5-Yr. Annualized Return: 4.30%
10-Yr. Annualized Return: 5.35%
FP040620_6.png

Strategic Advisers Fidelity Core Inc (FIWGX)

YTD Return: 1.10%
1-Yr. Return: 7.07%
3-Yr. Annualized Return: N/A
5-Yr. Annualized Return: N/A
10-Yr. Annualized Return: N/A
FP040620_5.png

Vanguard Intermediate-Term Corporate Bond ETF (VCIT)

YTD Return: -4.18%
1-Yr. Return: 4.02%
3-Yr. Annualized Return:3.69%
5-Yr. Annualized Return: 3.13%
10-Yr. Annualized Return: 5.10%
FP040620_4.png

iShares Short Treasury Bond ETF (SHV)

YTD Return: 2.77%
1-Yr. Return: 5.38%
3-Yr. Annualized Return:2.55%
5-Yr. Annualized Return: 1.70%
10-Yr. Annualized Return: 1.31%
FP040620_3.png

iShares 1-3 Year Treasury Bond ETF (SHY)

YTD Return: 2.77%
1-Yr. Return: 5.38%
3-Yr. Annualized Return:2.55%
5-Yr. Annualized Return: 1.70%
10-Yr. Annualized Return: 1.31%
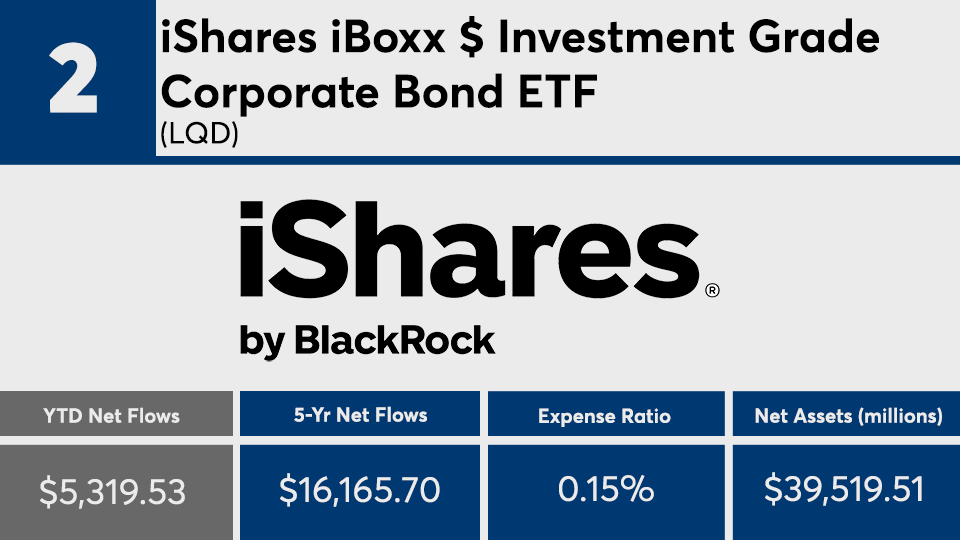
FP040620_2.png

iShares iBoxx $ Investment Grade Corporate Bond ETF (LQD)

YTD Return: -3.92%
1-Yr. Return: 6.48%
3-Yr. Annualized Return:4.66%
5-Yr. Annualized Return: 3.37%
10-Yr. Annualized Return: 5.32%
FP040620_1.png

SPDR Bloomberg Barclays 1-3 Month T-Bill ETF (BIL)

YTD Return: 0.42%
1-Yr. Return: 1.92%
3-Yr. Annualized Return:1.60%
5-Yr. Annualized Return: 0.98%
10-Yr. Annualized Return: 0.46%
MORE FROM FINANCIAL PLANNING