U.S. OUTPERFORMANCE IS AT RECORD LENGTH
U.S. stocks have outpaced international developed markets, but the cycle may be shifting.
U.S. equities have outperformed international developed markets stocks since the 2008-2009 global financial crisis, driven in part by the U.S.’s rapid resort to aggressive monetary easing that enabled an earlier economic recovery. As the U.S. economic cycle ages and the Federal Reserve gradually normalizes monetary policy, relative performance could be poised for a change.

As of June 30, 2018
Sources: FactSet, MSCI, S&P Dow Jones Indicies, T. Rowe Price.
Past performance cannot guarantee future results.
GROWTH CYCLE FAVORS INTERNATIONAL
Developed markets outside the U.S. are earlier in the growth cycle, with longer runways.
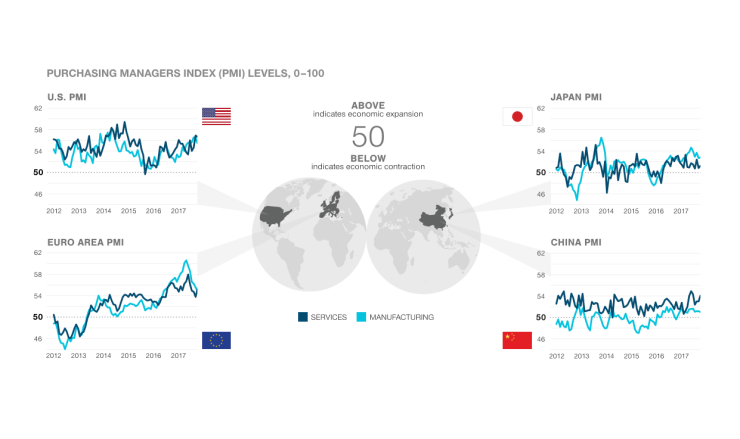
International developed countries are earlier in the economic cycle than the U.S. and benefit from still-supportive monetary policies. Europe and Japan should benefit as global growth drives a pickup in trade, although rising trade tensions pose a risk. Equity valuations outside the U.S. are relatively attractive and have room to improve.

As of June 30, 2018
Source: FactSet
The Purchasing Managers' Index (PMI) is an indicator of economic health for manufacturing and service sectors. The purpose of the PMI is to provide information about current business conditions.
ADVISORS MAY BE MISSING OUT
Many advisors are not fully diversified.
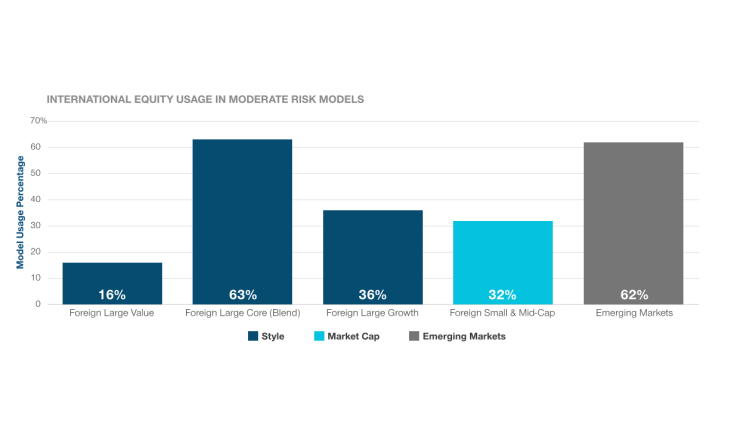
95% of advisors allocate a portion of their models to international equites but the majority are not diversifying by style and market capitalization. T. Rowe Price believes a well balanced portfolio utilizes value, core, and growth investment styles as well as a dedicated portion to emerging markets and foreign small and mid caps.

As of June 30, 2018
Sources: T. Rowe Price USIS-IPG proprietary Client Investment Platform (CIP) database
The Portfolio Construction Group attempts to align the model portfolio with the most similar Morningstar Target Risk index, which determines the corresponding risk model classification assigned to the model. The benchmark alignment and corresponding risk-model assignment is determined based on the model’s underlying allocations and the historical risk/return behavior of the model portfolio. Models that align closest with the Morningstar Moderate Target Risk index are classified as Moderate Risk Models. These models typically have between 50% and 70% of the model allocated to equity.
THE IMPACT OF DIVERSIFICATION
Asset allocation decisions can have a quantifiable impact on investment portfolios.
Applying the same principles often used in U.S. equity allocations, diversification across international investment styles and market capitalizations offer the potential for better risk-adjusted returns. Emerging markets stocks, for example, are a unique opportunity set and could be viewed as a key component of a broader international equity allocation.

As of June 30, 2018
Sources: Morningstar Direct. Analysis by T. Rowe Price
Diversification cannot assure a profit or protect against loss in a declining market. Performance does not reflect the expenses associated with the active management of an actual portfolio. Illustration assumes reinvestment of income and no transaction costs or taxes.
Category average performance is calculated net of fees and the underlying allocations are rebalanced monthly. Dividends and capital gains distributions are reinvested monthly. The performance shown is hypothetical and for illustrative purposes only and does not represent the performance of a specific investment product. For illustrative purposes.
See important disclosure below for definitions.
Past performance cannot guarantee future results
Important Information
Past performance cannot guarantee future results. All investments are subject to market risk, including the possible loss of principal. Investing overseas involves special risks, including political uncertainty; unfavorable currency exchange rates; and to a lesser degree, market illiquidity. All charts and tables are shown for illustrative purposes only.
This information is not intended to reflect a current or past recommendation, investment advice of any kind, or a solicitation of an offer to buy or sell any securities or investment services. The opinions and commentary provided do not take into account the investment objectives or financial situation of any particular investor or class of investor. Investors will need to consider their own circumstances before making an investment decision.
Information contained herein is based upon sources we consider to be reliable; we do not, however, guarantee its accuracy.
Copyright © 2018 FactSet Research Systems Inc. All rights reserved.
MSCI makes no express or implied warranties or representations and shall have no liability whatsoever with respect to any MSCI data contained herein. The MSCI data may not be further redistributed or used as a basis for other indices or any securities or financial products. This report is not approved, reviewed or produced by MSCI.
Copyright © 2018, S&P Global Market Intelligence (and its affiliates, as applicable). Reproduction of S&P Dow Jones Indicies in any form is prohibited except with the prior written permission of S&P Global Market Intelligence (“S&P”). None of S&P, its affiliates or their suppliers guarantee the accuracy, adequacy, completeness or availability of any information and is not responsible for any errors or omissions, regardless of the cause or for the results obtained from the use of such information. In no event shall S&P, its affiliates or any of their suppliers be liable for any damages, costs, expenses, legal fees, or losses (including lost income or lost profit and opportunity costs) in connection with any use of S&P information.
Copyright ©2018 Morningstar, Inc. All Rights Reserved. The information contained herein: (1) is proprietary to Morningstar and/or its content providers; (2) may not be copied or distributed; and (3) is not warranted to be accurate, complete or timely. Neither Morningstar nor its content providers are responsible for any damages or losses arising from any use of this information. Past performance is no guarantee of future results.
Batting Average: The number of months where the portfolio beat the index, MSCI EAFE
Sharpe Ratio: Is an investment measurement that is used to calculate the average return beyond the risk free rate of volatility per unit.
Standard Deviation: Indicates the volatility of a portfolio's total returns as measured against its mean performance.
T. Rowe Price Investment Services, Inc.,


