p198oerq731f5mhqe1mpbksd49i.jpg

Emerging Markets: How Do BRICs Stack Up Now?

It was only in 2001 that Goldman Sachs coined the term BRICs to refer to the rapidly developing emerging markets of Brazil, Russia, India and China. The designation caught on, as did the stocks of those countries. Over the past 10 years, as of Nov. 28, the MSCI BRIC Index gained 11% annually. But that performance was front-loaded: Over the past year, the BRIC index gained less than 1%. In contrast, MSCI’s U.S. broad market index had a 10-year annualized price return of 8.5%, but a one-year gain of 15.6%.

With investors increasingly looking to U.S. stocks and turning away from emerging market equities, many advisors are urging clients to rebalance into that sector. But each of the BRIC countries has its problems: Brazil and Russia have major oil operations that are suffering as crude hits a multi-year low. And Russia faces the additional problem of Western sanctions over its Ukraine stance. India’s stocks have surged recently, in part because of optimism that the new Prime Minister, Narendra Modi, will institute reforms that make it easier to do business. But the sharp run-up in Indian shares has left them more than 50% pricier than the broad emerging market. And China’s GDP growth has slowed from 10.5% annually from 1993 through 2007, to a still respectable 7.3% in the last quarter. One underappreciated problem with the Chinese economy is that the country’s population is rapidly aging, a result of the one-child policy begun in 1979.

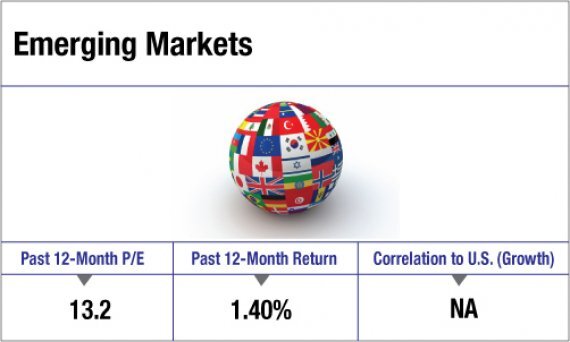
FactSet reports that the emerging markets as a whole had an anemic 1.4% return for the 12 months ending in November. But that underperformance and the broader diversification offered by the larger group may make emerging markets a better choice than BRICs for rebalancing. Details on the BRICs and emerging markets in general follow. -- Joseph Lisanti
View in a single-page version
here.
Sources: FactSet via T. Rowe Price, International Monetary Fund, fund websites
Data as of November 30, 2014.
Images: iStock
p198oeqvjf19ttpk5ccbrq1f3h8.jpg

BRAZIL

The new economic team announced at the end of November augurs well for Brazil’s efforts to boost its recently sluggish GDP growth. While most people think of Brazil as an oil play, financials and consumer stocks outweigh energy in the biggest total market Brazil ETFs. There are numerous ETFs that slice and dice the Brazilian market by sector or cap size, but the iShares MSCI Brazil Capped fund (EWZ) dominates the total market funds for this country with $4.8 billion in assets. Another choice is the $11.7 million Deutsche X-trackers MSCI Brazil Hedged Equity ETF (DBBR), which seeks to offset currency fluctuations via hedging.
p198oeqvjfn6m15vgeui4nf11hs9.jpg

RUSSIA

If you look only at valuation, the Russian market appears cheap. Yet the Russian economy is oil dependent and the price of crude recently hit a five-year low. The ETFs that track the Russian market have as much as 50% of their assets in the energy sector. Even if Russia hadn’t incurred the West’s sanctions over Ukraine, the oil situation makes the country’s stocks look dangerous. The oldest and biggest Russian equity ETF is the $1.9 billion Market Vectors Russia ETF, launched in 2007. A distant second in size is the iShares MSCI Russia Capped ETF at $237.6 million.
p198oeqvjf1jb41d2gnlh0s14rea.jpg

INDIA

In May, the world’s largest democracy elected Narendra Modi as Prime Minister. During the last decade of Modi’s tenure as chief minister of the Indian state of Gujarat, that region’s GDP growth outpaced the country’s by 2.4 percentage points annually. Indian stocks have surged and the country’s market now has a trailing P/E higher than the other BRIC markets. The largest total market Indian ETF is the $2.3 billion WisdomTree India Earnings Fund (EPI) that weights by earnings. Close behind is the iShares MSCI India ETF with $1.9 billion in assets.
p198oeqvjg1e8b16l67evlcuipib.jpg

CHINA

China’s economy has slowed and its market returned only 3.35% over 12 months. Yet the P/E is a reasonable 10.1 times earnings. Despite slowing, the Chinese economy grew 7.3% in the last quarter. Even so, China faces a demographic problem from its one-child policy. The Chinese population is rapidly aging and fewer workers will be supporting retirees in the years ahead. The two biggest ETFs that track the broad China market are the $1.3 billion iShares MSCI China ETF (MCHI) and the $1 billion SPDR S&P China ETF (GXC).
p198oeqvjgsug1rh7tbio4oadnc.jpg

EMERGING MARKETS

A more diversified approach is to invest in a broader, emerging-markets ETF. The two largest are Vanguard FTSE Emerging Markets ETF ($65.7 billion in assets) and the iShares MSCI Emerging Markets ETF ($35.9 billion). The FTSE index has a higher weighting in BRIC countries (47.1%) than does the MSCI index (42%). The reason is Korea. As the oldest emerging markets index (launched in 1988), the MSCI benchmark includes Korea, which was an emerging market at that time. Korea has never been removed even though most people now consider it a developed market. The result is that the heavy weighting of Korea helps to dilute the effects of the BRIC markets on the MSCI EM index. The FTSE EM benchmark excludes Korea.
MORE FROM FINANCIAL PLANNING