FP7516_0_edited-1.png

FP50 2016: Which IBDs have the fastest-growing payouts?

Among the 50 biggest independent broker-dealers, the average payout ranges from less than $105,000 to more than $450,000. But some firms have seen particularly rapid growth. See which firm reaped 31% growth in this ranking of the top 10 firms, plus take a look at their average payout overall.

Data are as of year-end 2015. For more in-depth coverage, please see our cover story, A shakeout for the nations-biggest IBDs. Take a deep dive into the data with our list of Top 10 IBDs by revenue growth and the IBDs with the richest accounts.

We welcome your insights in the comment section.
FP7516_10copy.png

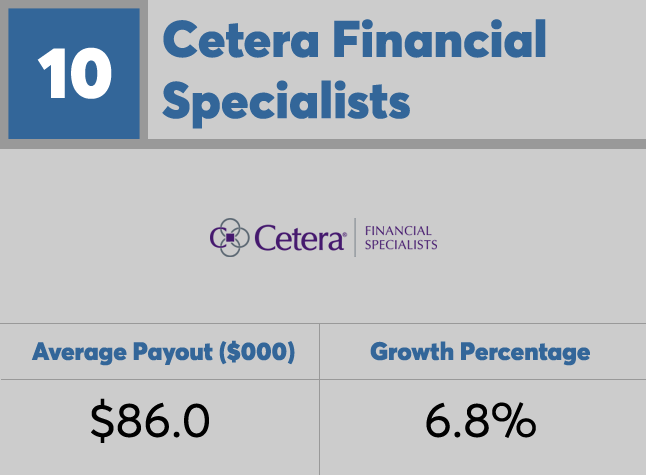
10. Cetera Financial Specialists

Average Payout ($000): $86.0
Growth Percentage: 6.8%
FP7516_9copy.png

9. Northwestern Mutual Investment Services

Average Payout ($000): $105.2
Growth Percentage: 7.6%
FP7516_8copy.png

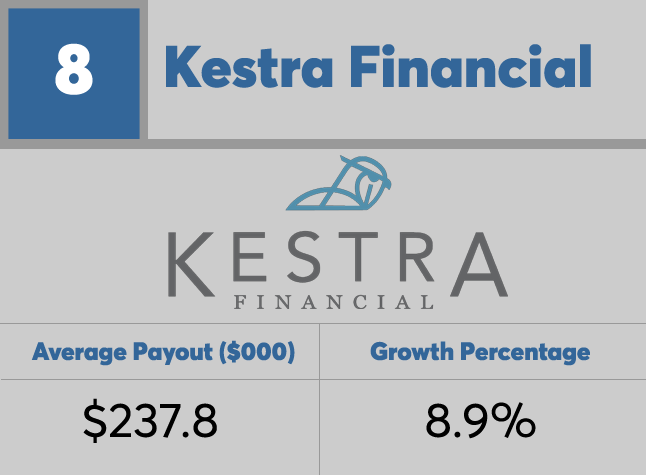
8. Kestra Financial

Average Payout ($000): $237.8
Growth Percentage: 8.9%
FP7516_7copy.png

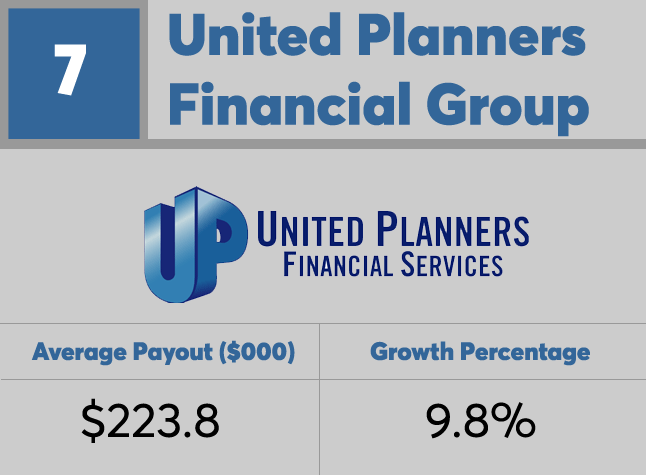
7. United Planners Financial Services

Average Payout ($000): $223.8
Growth Percentage: 9.8%
FP7516_6copy.png

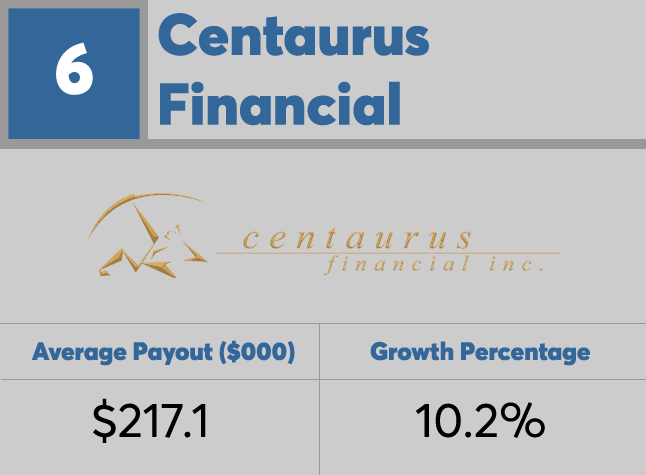
6. Centaurus Financial

Average Payout ($000): $217.1
Growth Percentage: 10.2%
FP7516_5copy.png

5. Independent Financial Group

Average Payout ($000): $203.2
Growth Percentage: 10.3%
FP7516_4copy.png

4. Kovack Securities

Average Payout ($000): $168.8
Growth Percentage: 12.5%
FP7516_3copy.png

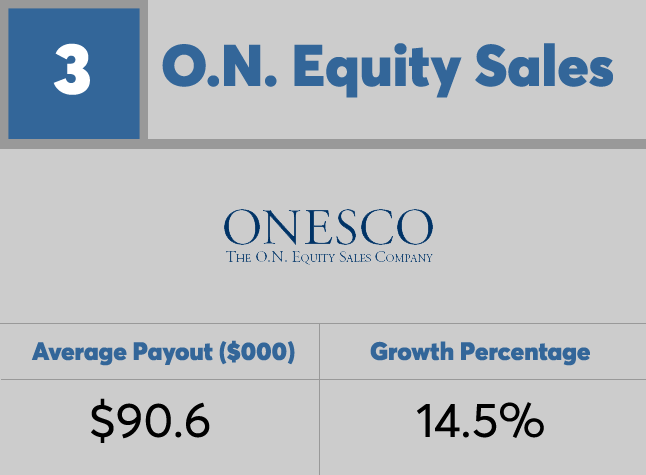
3. O.N. Equity Sales

Average Payout ($000): $90.6
Growth Percentage: 14.5%
FP7516_2copy.png

2. Securities Service Network

Average Payout ($000): $293.8
Growth Percentage: 18.1%
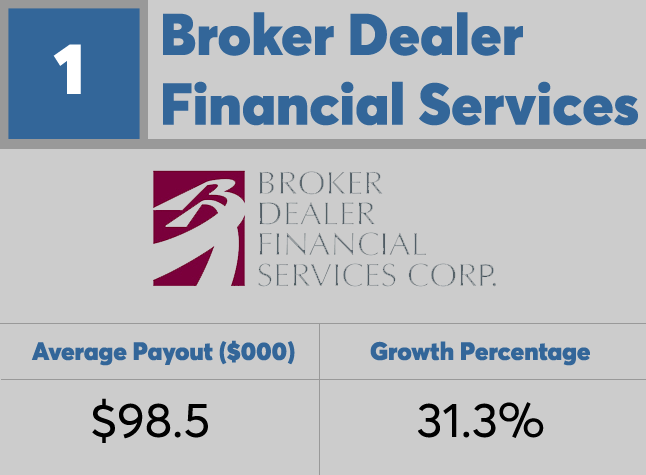
FP7516_1copy.png

1. Broker Dealer Financial Services

Average Payout ($000): $98.5
Growth Percentage: 31.3%
MORE FROM FINANCIAL PLANNING