Among all bond funds, those with significant holdings in corporate debt were hit particularly hard last year.
The 20 worst-performing fixed-income funds had an average one-year loss of 0.15%, according to Morningstar Direct data. Among those funds’ oldest share classes, the average sector exposure to corporate credit was roughly 38%; 8 percentage points higher than the industry average, Morningstar data show. All but two had at least some exposure to the sector. (The data includes funds in which assets were transferred from one share class to another.)
“Within funds that held a significant allocation to corporate credit, investment-grade credit underperformed high-yield for the year,” says Morningstar senior analyst Emory Zink. However, she notes that the fourth quarter was particularly tough for high-yield, “as factors including rising interest rates, dipping oil prices, a government shutdown, and slower forecasted economic growth all contributed to pressure on the sector.”
Funds in this ranking, which hold a combined $215 billion in client assets, included government bonds, high-yield municipal bond, multistrategy and global bond funds. Emerging markets, multisector, high-yield and inflation-protected categories had the largest showing.
Fees were especially reflective of performance, Zink says. Among funds with the worst returns, the bottom 20 had an average expense ratio of 70 basis points, nearly 20 points more than the
“Lower fees, over time, provide a persistent performance advantage for a fund relative to peers with higher fees, [which] must clear a higher performance hurdle before returns are passed along to investors,” Zink says.
Despite these funds’ poor performance, Zink says advisors with clients with holdings in any of these products must remember their long-term objectives.
“When evaluating bond funds, it is important to focus on whether a bond fund behaved as an investor would expect given the team’s mandate and resources,” she says. “There are stress periods when a fund’s strategy may put it at a disadvantage, but over longer periods of time, an investor should ask, ‘Has the fund played the role that I expect it to play in my total portfolio?’ ”
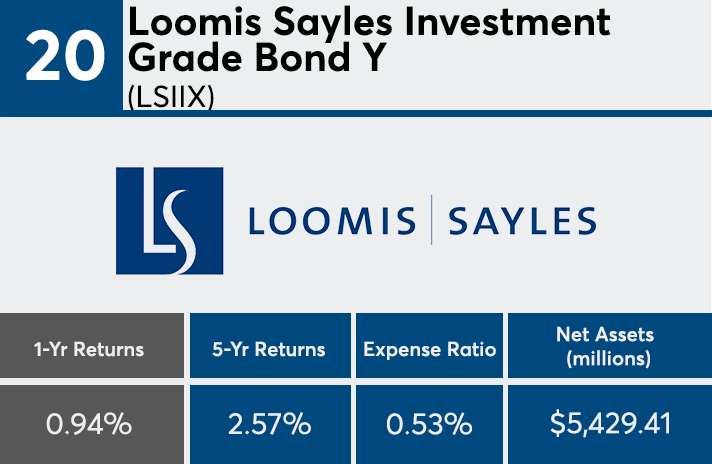
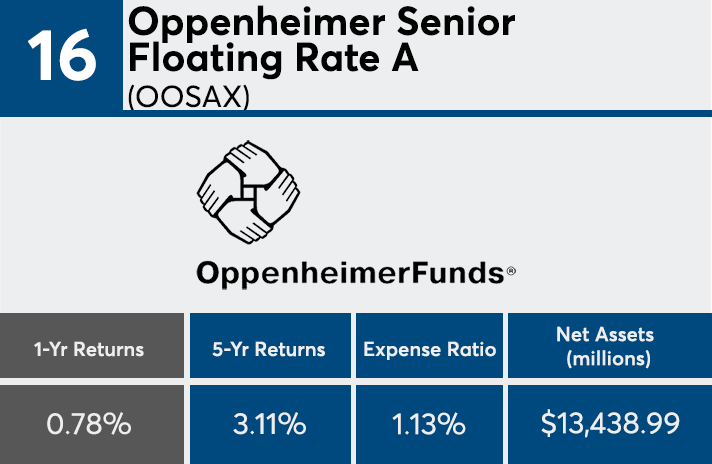
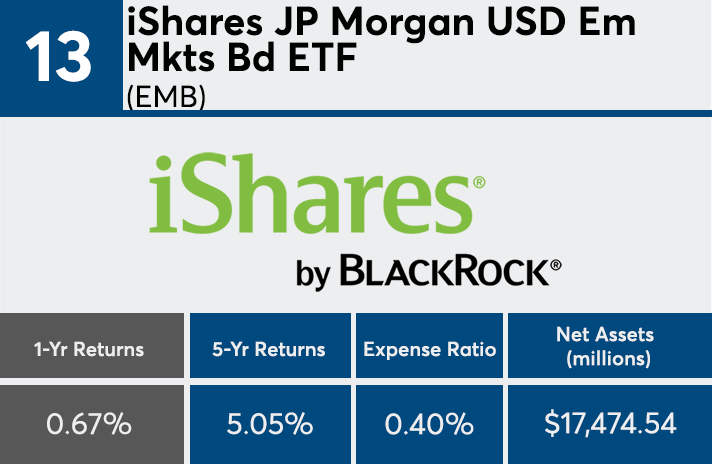
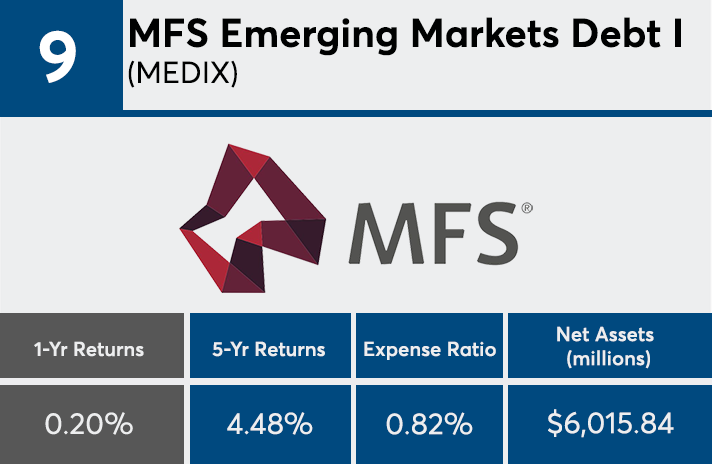
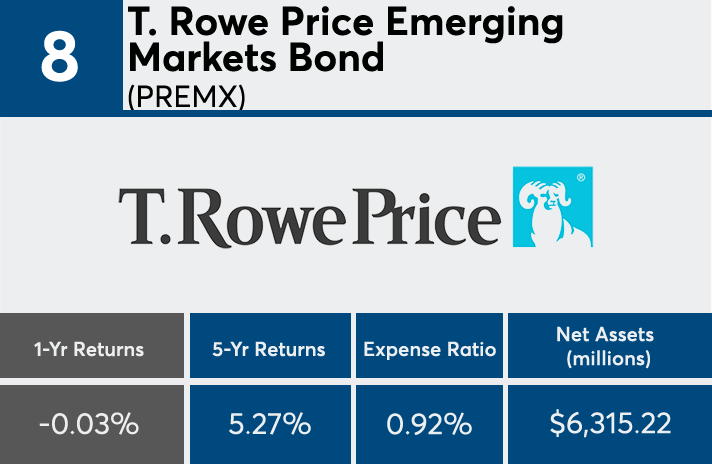
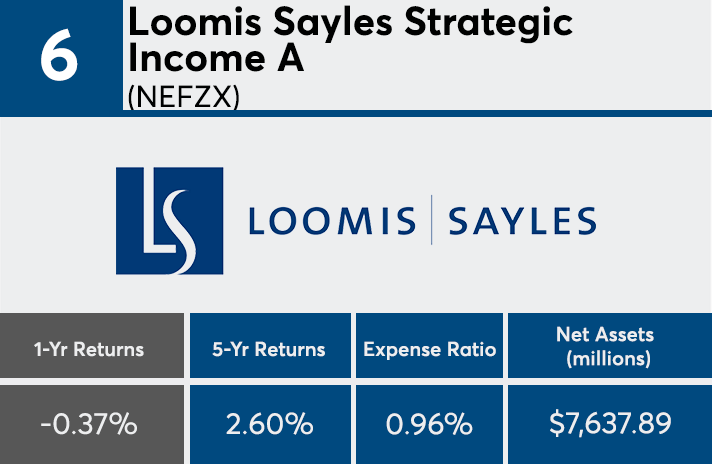
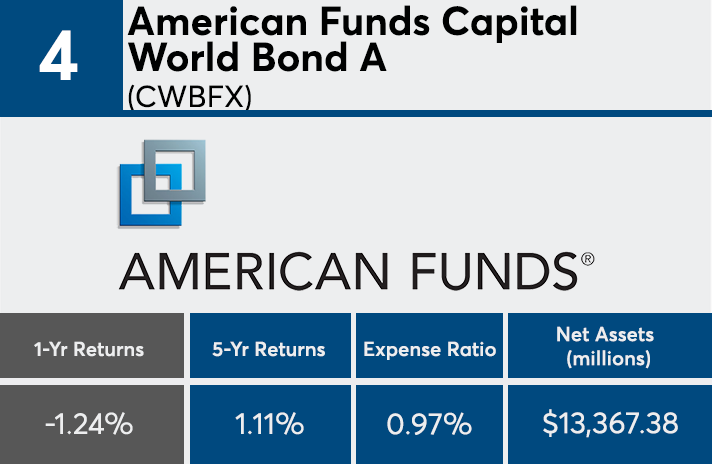
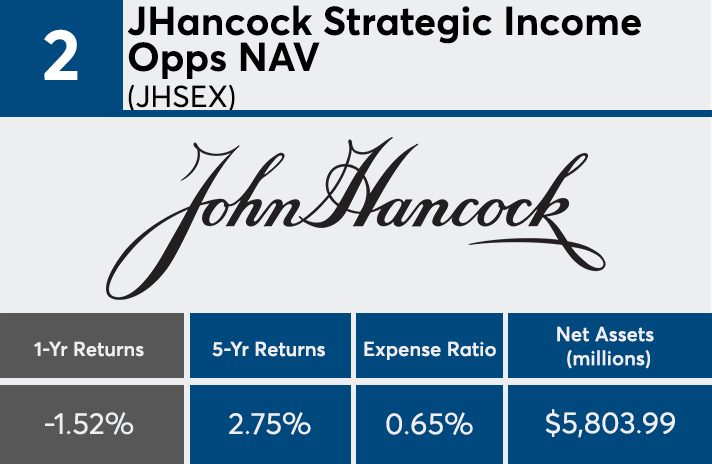
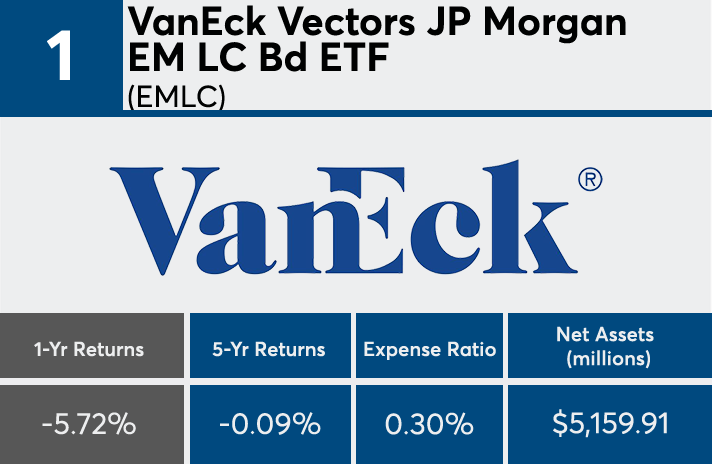
Scroll through to see the 20 fixed-income mutual funds and ETFs’ oldest share classes with the lowest one-year returns, as of Feb. 7. Institutional, leveraged and funds with investment minimums over $100,000 are excluded, as were funds with AUM of less than $5 billion. Five-year returns, total assets and expense ratios are also listed. All data from Morningstar Direct.
