Worst-performing funds of 2020

Quiet commuter lines, passengerless airplanes and empty highways. Analysis of the 20 worst-performing funds of 2020, with at least $100 million in assets, reflect a world engaged in social distancing and lockdowns. Mutual funds tracking energy were among the worst-performers.

The 20 funds with the worst returns delivered an average loss of more than 30%, Morningstar Direct data show. Over the last three years, the same funds produced a loss of nearly 15%.

For comparison, index trackers such as the SPDR S&P 500 ETF Trust (SPY) and the SPDR Dow Jones Industrial Average ETF Trust (DIA) generated YTD returns of 16.20% and 7.52%, respectively, data show. SPY and DIA had three-year annualized gains of 13.26% and 8.99%. In bonds, the iShares Core U.S. Aggregate Bond ETF (AGG) had gains of 7.22% and 5.39% over the YTD and three-year periods.

Given the work from home environment and drop in daily commutes, “it’s not a surprise in hindsight that energy companies suffered,” says Rusty Vanneman, chief investment strategist at Orion Advisor Solutions. “But, they arguably probably shouldn’t have suffered as much as they have. Over the last 20 years, energy stocks have traded at a 10%-15% discount to the overall market. They now trade at nearly a 60% discount.”

Fees here range from as low as 10 basis points to as high as 1.54%, data show. Though on par with the high costs associated with the year’s top-performing funds, these funds were also more than twice the 0.45% investors paid for fund investing last year, according to Morningstar’s most recent annual fee survey.

“Being a good advisor might sound easy, but it’s not,” Vanneman says. “Getting investors to think long-term, to diversify, and to rebalance portfolios is an ongoing conversation, which requires education and encouragement.”

Scroll through to see the 20 mutual funds and ETFs with the biggest YTD losses through Dec. 23. Funds with less than $100 million in AUM were excluded, as were funds with investment minimums above $100,000, leveraged and institutional funds. Assets and expense ratios, as well as one-, three-, five- and 10-year returns are also listed for each. Minimum initial investments and loads are also listed when applicable. The data show each fund's primary share class. All data is from Morningstar Direct.

FP122820_20 copy.png

AQR Style Premia Alternative R6 (QSPRX)

1-Yr. Return: -25.65%
5-Yr. Annualized Return: -7.46%
10-Yr. Annualized Return: N/A
Minimum Initial Investment: $100,000
FP122820_19 copy.png

Invesco SteelPath MLP Select 40 Y (MLPTX)

1-Yr. Return: -23.1%
5-Yr. Annualized Return: -2.27%
10-Yr. Annualized Return: -0.71%
Minimum Initial Investment: $1,000
FP122820_18 copy.png

Goldman Sachs Commodity Strategy A (GSCAX)

1-Yr. Return: -24.7%
5-Yr. Annualized Return: -2.6%
10-Yr. Annualized Return: -9%
Minimum Initial Investment: $1,000
Front Load: 4.50%
FP122820_17 copy.png

MainGate MLP A (AMLPX)

1-Yr. Return: -25.81%
5-Yr. Annualized Return: -5.85%
10-Yr. Annualized Return: N/A
Minimum Initial Investment: $2,500
Front Load: 5.75%
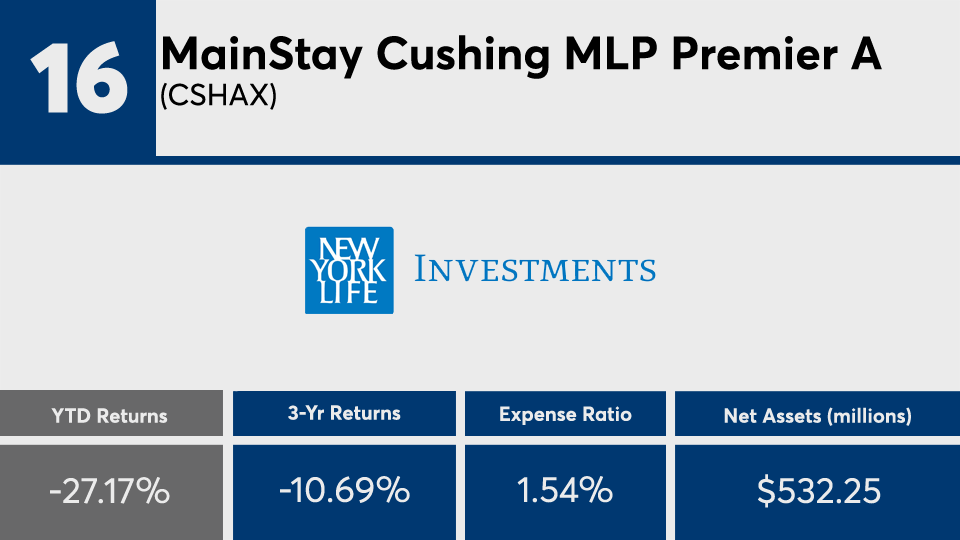
FP122820_16 copy.png

MainStay Cushing MLP Premier A (CSHAX)

1-Yr. Return: -26.83%
5-Yr. Annualized Return: -2.89%
10-Yr. Annualized Return: -3.1%
Minimum Initial Investment: $15,000
Front Load: 5.50%
FP122820_15 copy.png

Invesco SteelPath MLP Alpha Y (MLPOX)

1-Yr. Return: -26.17%
5-Yr. Annualized Return: -3.64%
10-Yr. Annualized Return: -2.32%
Minimum Initial Investment: $1,000
FP122820_14 copy.png

Braddock Multi-Strategy Income A (BDKAX)

1-Yr. Return: -28.18%
5-Yr. Annualized Return: N/A
10-Yr. Annualized Return: N/A
Minimum Initial Investment: $2,500
Front Load: 4.25%
FP122820_13 copy.png

Recurrent MLP & Infrastructure Class I (RMLPX)

1-Yr. Return: -28.06%
5-Yr. Annualized Return: N/A
10-Yr. Annualized Return: N/A
Minimum Initial Investment: $2,500
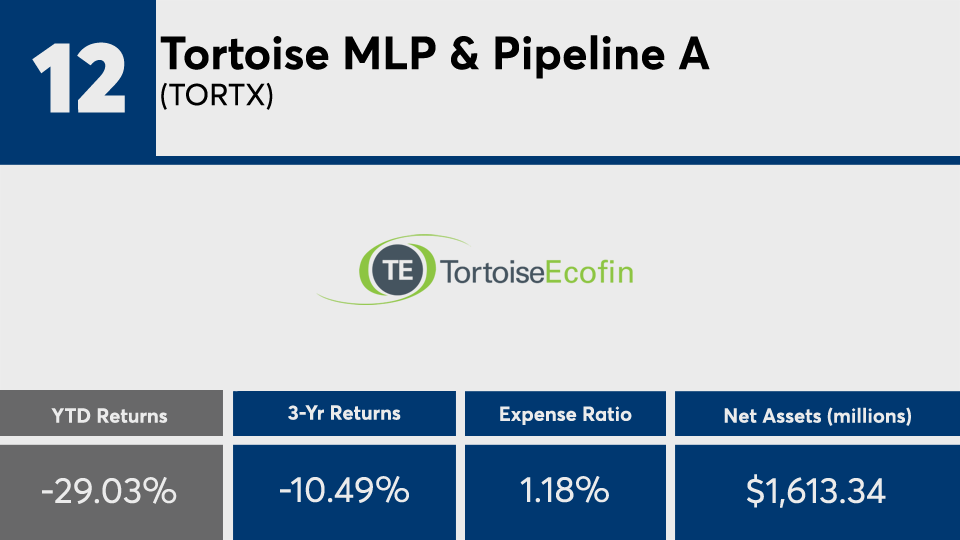
FP122820_12 copy.png

Tortoise MLP & Pipeline A (TORTX)

1-Yr. Return: -28.4%
5-Yr. Annualized Return: 0.67%
10-Yr. Annualized Return: N/A
Minimum Initial Investment: $2,500
Front Load: 5.50%
FP122820_11 copy.png

Goldman Sachs MLP Energy Infrastructure P (GMNPX)

1-Yr. Return: -29.67%
5-Yr. Annualized Return: N/A
10-Yr. Annualized Return: N/A
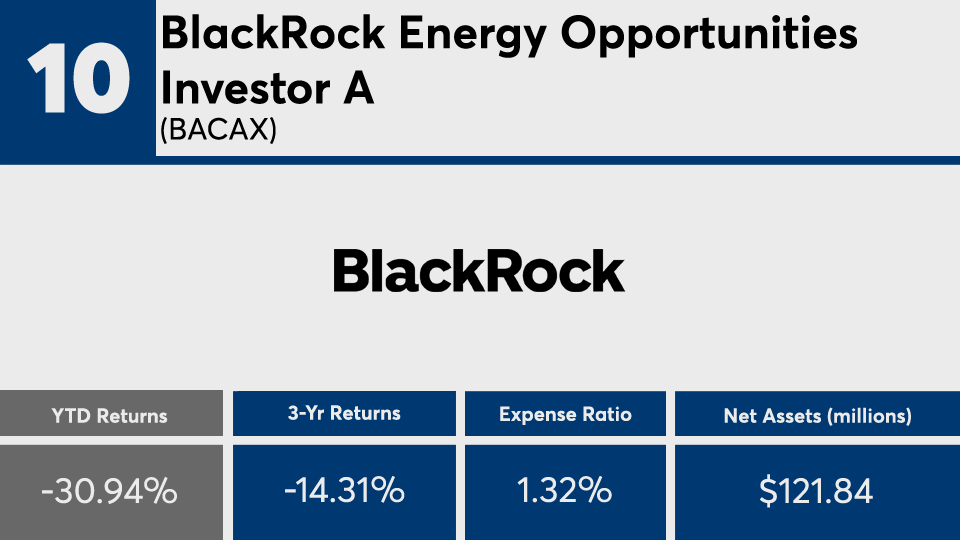
FP122820_10 copy.png

BlackRock Energy Opportunities Investor A (BACAX)

1-Yr. Return: -30.14%
5-Yr. Annualized Return: -3.89%
10-Yr. Annualized Return: -7.08%
Minimum Initial Investment: $1,000
Front Load: 5.25%
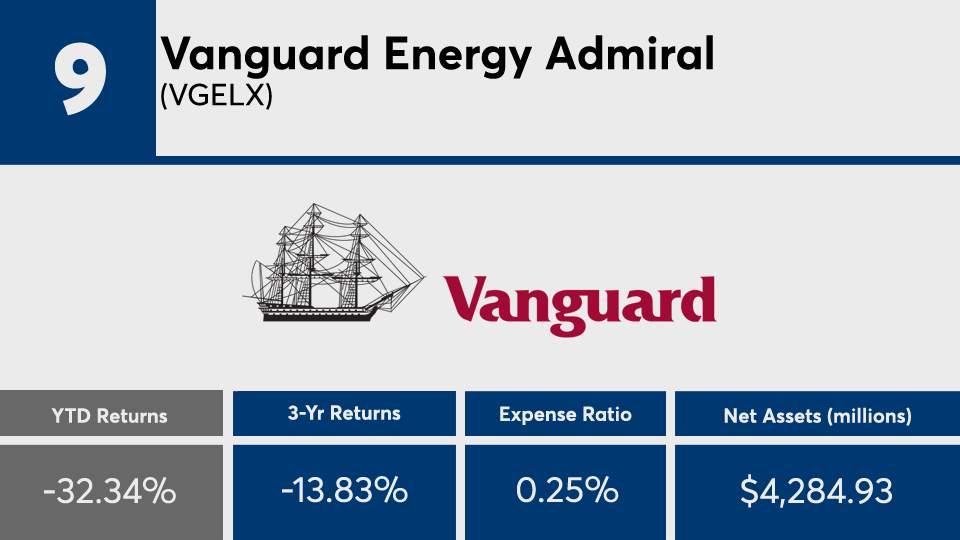
FP122820_9 copy.png

Vanguard Energy Admiral (VGELX)

1-Yr. Return: -31.55%
5-Yr. Annualized Return: -2.26%
10-Yr. Annualized Return: -3.32%
Minimum Initial Investment: $50,000
FP122820_8 copy.png

Invesco Energy A (IENAX)

1-Yr. Return: -32.67%
5-Yr. Annualized Return: -9.94%
10-Yr. Annualized Return: -9.2%
Minimum Initial Investment: $1,000
Front Load: 5.50%
FP122820_7 copy.png

Fidelity Advisor Energy I (FANIX)

1-Yr. Return: -32.96%
5-Yr. Annualized Return: -6.19%
10-Yr. Annualized Return: -4.65%
FP122820_6 copy.png

Vanguard Energy Index Admiral (VENAX)

1-Yr. Return: -33.04%
5-Yr. Annualized Return: -5.88%
10-Yr. Annualized Return: -3.72%
Minimum Initial Investment: $100,000
FP122820_5 copy.png

Fidelity Select Energy (FSENX)

1-Yr. Return: -32.99%
5-Yr. Annualized Return: -6.16%
10-Yr. Annualized Return: -4.68%
FP122820_4 copy.png

Center Coast Brookfield Midstream Focus Y (CCCNX)

1-Yr. Return: -34.29%
5-Yr. Annualized Return: -6.82%
10-Yr. Annualized Return: N/A
Minimum Initial Investment: $1,000
FP122820_3 copy.png

Spirit of America Energy A (SOAEX)

1-Yr. Return: -34.25%
5-Yr. Annualized Return: -6.25%
10-Yr. Annualized Return: N/A
Minimum Initial Investment: $500
Front Load: 5.75%
FP122820_2 copy.png

Fidelity Select Energy Service Portfolio (FSESX)

1-Yr. Return: -35.9%
5-Yr. Annualized Return: -15.67%
10-Yr. Annualized Return: -12.22%
FP122820_1 copy.png

Ivy Energy I (IVEIX)

1-Yr. Return: -38.54%
5-Yr. Annualized Return: -12.81%
10-Yr. Annualized Return: -8.75%
MORE FROM FINANCIAL PLANNING