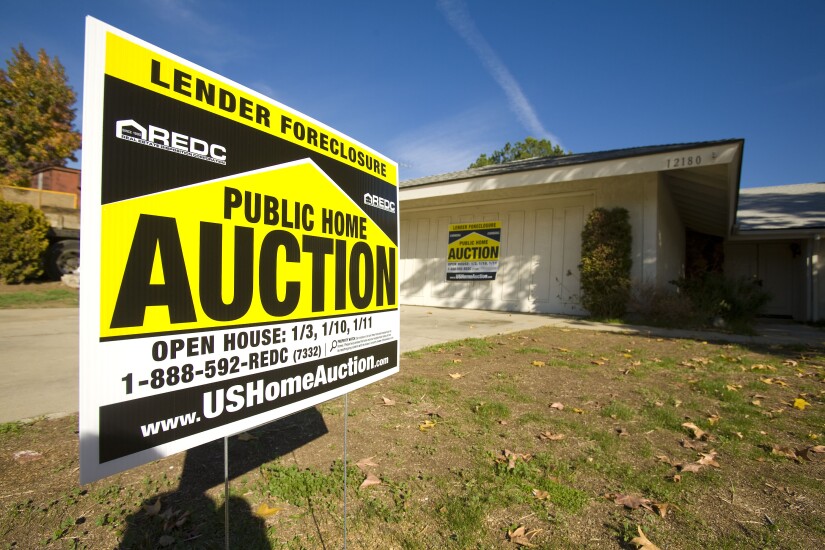
While overall foreclosure activity is declining nationwide, the number of foreclosure starts in April increased over the previous year in 99 of the 219 metro areas tracked by Attom Data Solutions.
Foreclosure activity — including starts, second notices and properties becoming real estate owned — fell 17% in April from the previous year.
This marks 31 consecutive months where total activity fell from the previous year. The nationwide foreclosure rate is one filing for every 2,089 housing units. There were 64,183 properties with a foreclosure filing during April. But total foreclosure activity increased compared with April 2017 in 24% of the markets tracked by Attom.
Meanwhile, foreclosure starts fell 1% nationwide in April compared with the previous year. Even with the small decline, that makes 34 consecutive months with fewer foreclosure starts on a year-over-year basis.
Lenders came into possession of 14,233 properties during the month, down by 45% from March and by 45% from April 2017. This makes 15 consecutive months where the number of properties becoming real estate owned declined.
Here's a look at 12 housing markets with a population over 1 million people where the number of foreclosure starts increased the most on a percentage basis from a year ago, based on data aggregated by Attom.
A foreclosure start is measured as the first notice the borrower received from the servicer. Depending on the state, that could be a notice of default, a lis pendens (which is a written notice that states a lawsuit has been filed concerning real estate) or a notice of trustee sale. Foreclosure completion is where a property has become REO of the mortgage holder following a foreclosure sale.
The data about foreclosure actions per housing units includes both of the above, plus a second notice sent to the borrower that is required in some states, which can be either a notice of trustee sale or a notice of default sale.

No. 12: San Francisco-Oakland, California
Foreclosure completions: 40 (-54% year-over-year)
One foreclosure action per 3,763 housing units

No. 11: Memphis
Foreclosure completions: 73 (-75% year-over-year)
One foreclosure action per 2,291 housing units

No. 10: Denver
Foreclosure completions: 46 (-42% year-over-year)
One foreclosure action per 3,740 housing units

No. 9: Riverside, California
Foreclosure completions: 201 (-28% year-over-year)
One foreclosure action per 1,084 housing units

No. 8: San Jose, California
Foreclosure completions: 8 (-20% year-over-year)
One foreclosure action per 5,000 housing units

No. 7: Austin, Texas
Foreclosure completions: 17 (-78% year-over-year)
One foreclosure action per 5,387 housing units

No. 6: Grand Rapids, Michigan
Foreclosure completions: 21 (-80% year-over-year)
One foreclosure action per 4,987 housing units

No. 5: Sacramento, California
Foreclosure completions: 60 (-60% year-over-year)
One foreclosure action per 1,852 housing units

No. 4: Nashville, Tennessee
Foreclosure completions: 31 (-70% year-over-year)
One foreclosure action per 4,474 housing units

No. 3: Detroit
Foreclosure completions: 238 (-46% year-over-year)
One foreclosure action per 2,713 housing units

No. 2: Indianapolis
Foreclosure completions: 208 (58% year-over-year)
One foreclosure action per 1,343 housing units

No. 1: Tucson, Arizona
Foreclosure completions: 40 (-75% year-over-year)
One foreclosure action per 2,636 housing units


