Still, though, when taking a longer-term view of three to five years, both energy and precious metals are still down, notes Andrew Daniels, equity strategies analyst at Morningstar.
Another notable result was the small-cap comeback, Daniels said. Those smaller companies have historically outperformed large-caps, although that has not been the case over the previous couple of years. He noted that the potential for fiscal stimulus (spending on infrastructure as one example) can create potential growth for small-caps.
Lipper's Roseen summed up by saying that chasing performance can be hazardous to a client's portfolio, noting that "last year’s cellar dwellers turned into this year’s darlings."
Scroll through to see all the big comeback market stories. Comebacks were measured by the largest percentage point increase in 2016 year-to-date performance over 2015 performance. All data is from Morningstar.
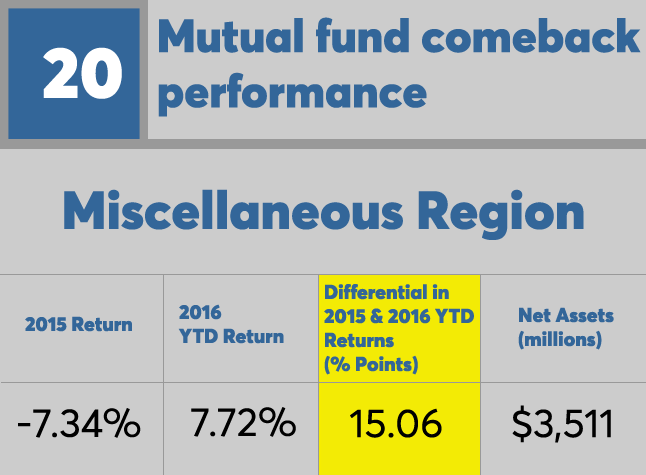
20. Miscellaneous Region
2016 YTD Return: 7.72%
Differential in 2015 & 2016 YTD Returns (% Points): 15.06
Net Assets (millions): $3,511
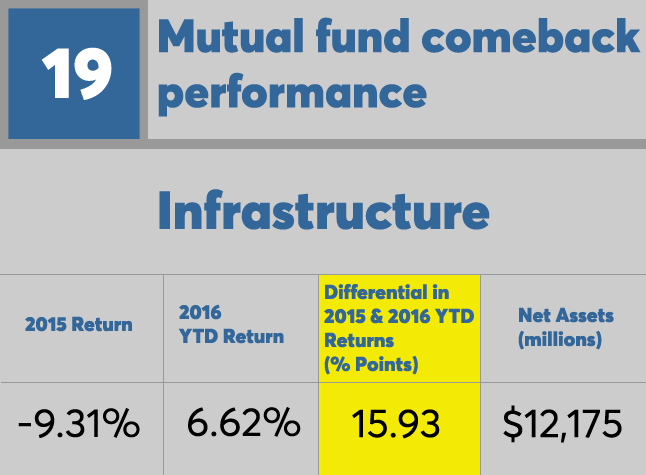
19. Infrastructure
2016 YTD Return: 6.62%
Differential in 2015 & 2016 YTD Returns (% Points): 15.93
Net Assets (millions): $12,175

18. High Yield Bond
2016 YTD Return: 12.05%
Differential in 2015 & 2016 YTD Returns (% Points): 16.17
Net Assets (millions): $263,768

17. Financial
2016 YTD Return: 16.40%
Differential in 2015 & 2016 YTD Returns (% Points): 17.23
Net Assets (millions): $8,666

16. Large Value
2016 YTD Return: 13.48%
Differential in 2015 & 2016 YTD Returns (% Points): 17.34
Net Assets (millions): $877,860

15. Mid-Cap Blend
2016 YTD Return: 13.83%
Differential in 2015 & 2016 YTD Returns (% Points): 18.39
Net Assets (millions): $254,364

14. Utilities
2016 YTD Return: 9.35%
Differential in 2015 & 2016 YTD Returns (% Points): 19.56
Net Assets (millions): $21,591
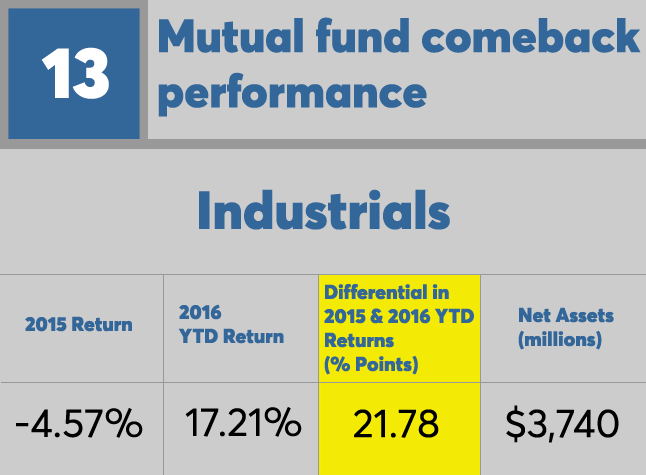
13. Industrials
2016 YTD Return: 17.21%
Differential in 2015 & 2016 YTD Returns (% Points): 21.78
Net Assets (millions): $3,740
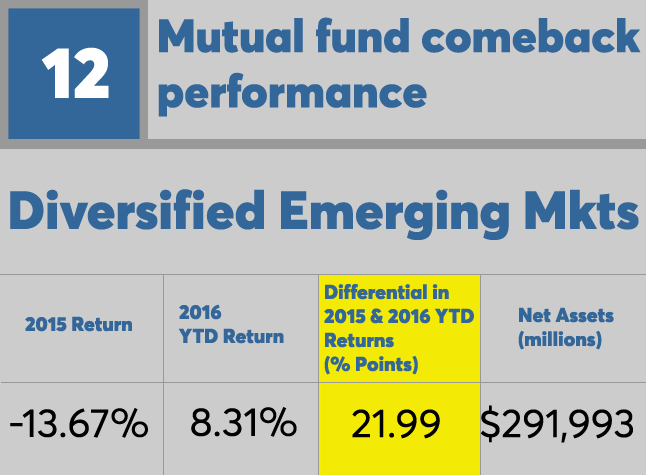
12. Diversified Emerging Mkts
2016 YTD Return: 8.31%
Differential in 2015 & 2016 YTD Returns (% Points): 21.99
Net Assets (millions): $291,993

11. Trading-Leveraged Equity
2016 YTD Return: 17.04%
Differential in 2015 & 2016 YTD Returns (% Points): 22.55
Net Assets (millions): $3,221

10. Mid-Cap Value
2016 YTD Return: 17.49%
Differential in 2015 & 2016 YTD Returns (% Points): 22.68
Net Assets (millions): $190,381

9. Emerging Markets - Local Curre
2016 YTD Return: 8.08%
Differential in 2015 & 2016 YTD Returns (% Points): 22.77
Net Assets (millions): $8,098

8. Small Blend
2016 YTD Return: 19.85%
Differential in 2015 & 2016 YTD Returns (% Points): 25.24
Net Assets (millions): $215,295
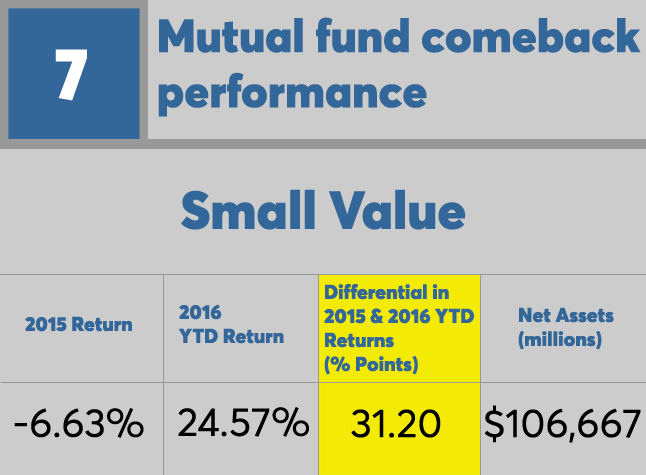
7. Small Value
2016 YTD Return: 24.57%
Differential in 2015 & 2016 YTD Returns (% Points): 31.20
Net Assets (millions): $106,667

6. Commodities Broad Basket
2016 YTD Return: 12.54%
Differential in 2015 & 2016 YTD Returns (% Points): 35.98
Net Assets (millions): $25,818

5. Natural Resources
2016 YTD Return: 28.35%
Differential in 2015 & 2016 YTD Returns (% Points): 50.47
Net Assets (millions): $21,879
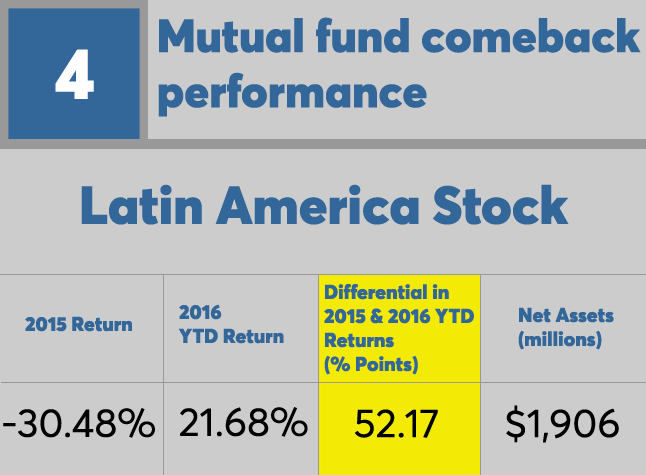
4. Latin America Stock
2016 YTD Return: 21.68%
Differential in 2015 & 2016 YTD Returns (% Points): 52.17
Net Assets (millions): $1,906

3. Energy Limited Partnership
2016 YTD Return: 21.52%
Differential in 2015 & 2016 YTD Returns (% Points): 55
Net Assets (millions): $25,578
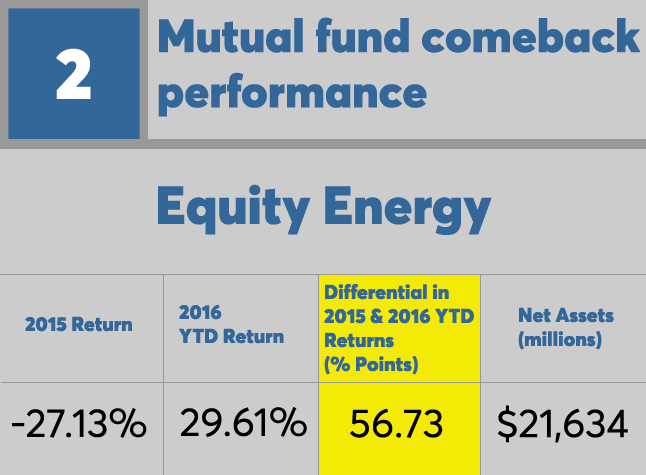
2. Equity Energy
2016 YTD Return: 29.61%
Differential in 2015 & 2016 YTD Returns (% Points): 56.73
Net Assets (millions): $21,634
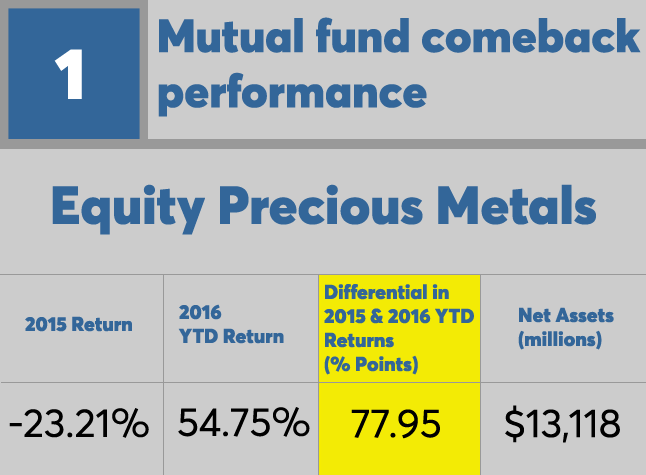
1. Equity Precious Metals
2016 YTD Return: 54.75%
Differential in 2015 & 2016 YTD Returns (% Points): 77.95
Net Assets (millions): $13,118
