Where can advisors get paid the most?
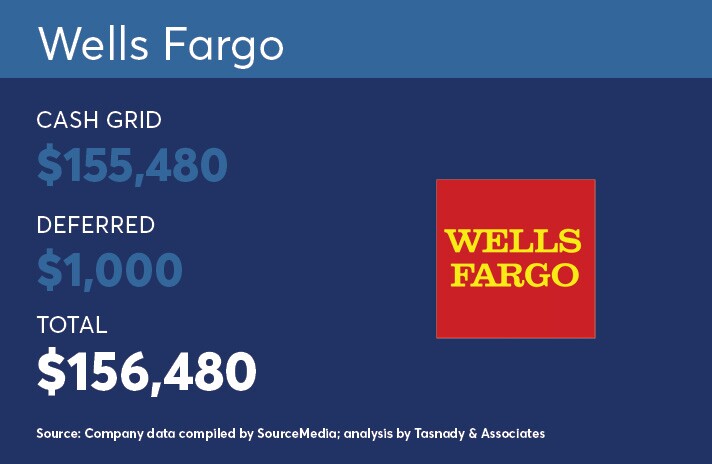
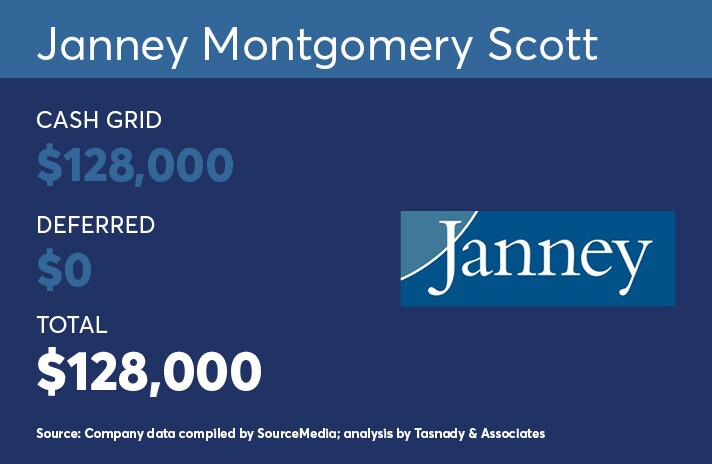
To answer this perennial question, On Wall Street annually compiles an analysis looking at the starting payouts for advisors at wirehouse, regional and national brokerage firms. This analysis is comprised of four different production levels. Core payout grids remained largely untouched across, with two exceptions: Wells Fargo and Janney Montgomery Scott, both which did a grid stretch.
Meanwhile, bonuses and penalties designed to spur advisors to work with wealthy clients are ever more in vogue.
“Most of the time the grid isn’t changing. It’s these other areas where the action often is,” says compensation consultant Andy Tasnady, who helped prepare this year’s analysis.
For
Bonuses combined with household minimums are intended to push advisors to be more efficient.
“You can’t really grow without focusing on larger accounts because you max out,” Tasnady says. “You run out of time to serve too many smaller accounts.”
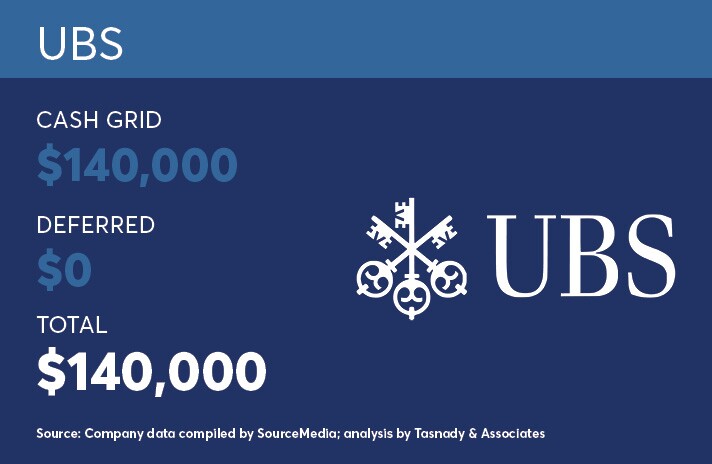
UBS, meanwhile, kept it’s compensation plan unchanged. Regional BDs typically do not make annual changes to their plans, though there have been shifts in recent years. In 2017,
That same year, Ameriprise Financial changed up its mix of cash and deferred pay. The max payout is currently 46% cash and 8% deferred, whereas it was previously 47% cash and 7% deferred. An Ameriprise spokeswoman said the changes were made “after a careful review of the cash and deferred compensation mix we offer.” She also pointed out that the firm provides resources and incentives to advisors beyond its comp grid, including a financial planning bonus. The company declined to provide data for this analysis.
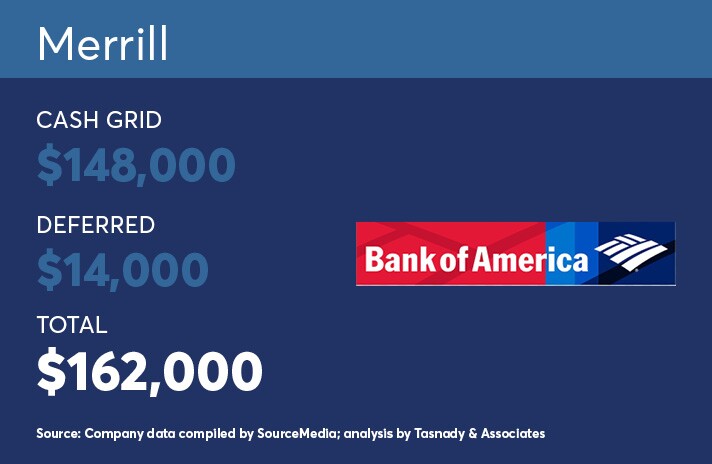
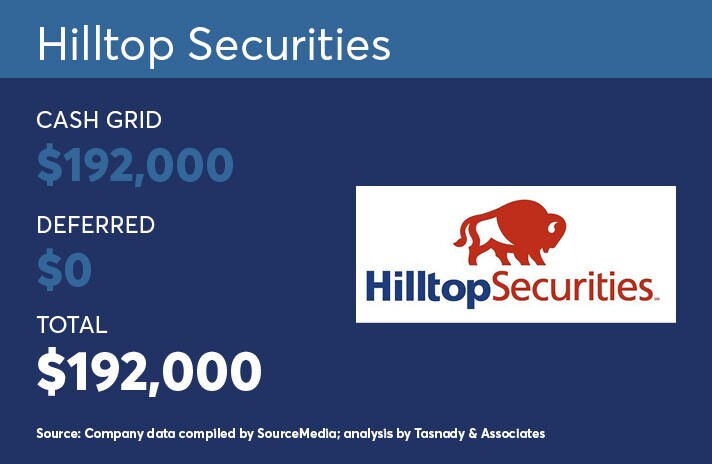
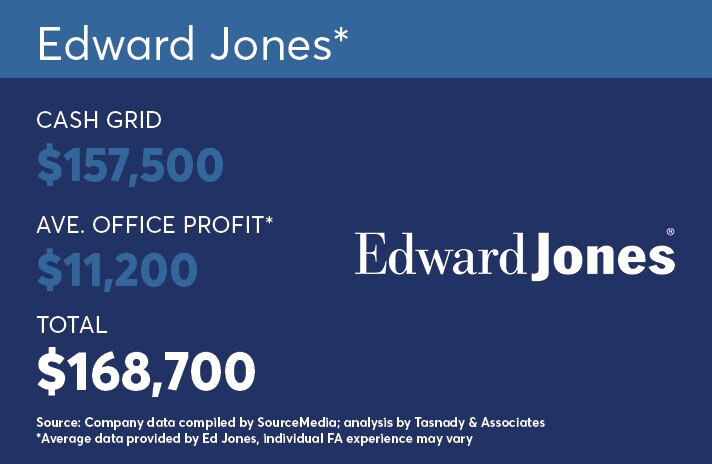
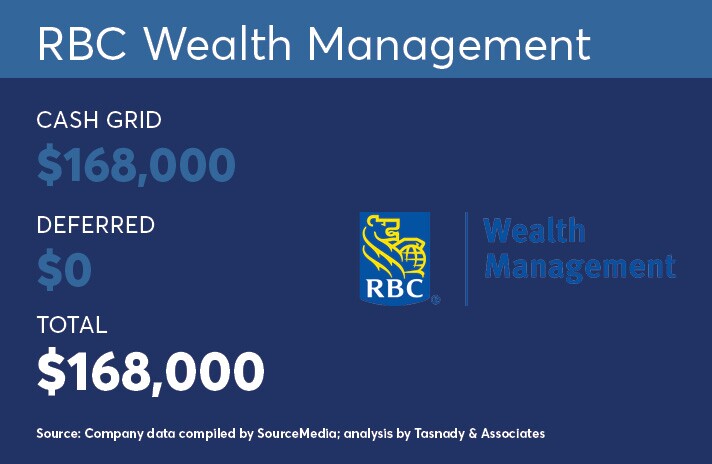
Scroll through to see how compensation plans compare in 2019.
To see last year's compensation analysis,
Data was collected by SourceMedia and analysis conducted by Tasnady & Associates.
A number of special policies are not included here since they do not affect 100% of the population evenly and therefore are more haphazard to compare. Individual results can vary dramatically, based on the mix of business and policies at each firm. For example, pay can rise from special bonuses and fall from penalties such as discount sharing, small client limits and ticket charges
Assumptions for basic pay (prior to special policies/contingent bonuses):
- 25% in individual stocks; 25% in individual bonds; 25% in mutual funds; 25% in fee-based (wrap accounts, managed accounts, etc.)
- Year-end basic bonuses are shown in deferred totals.
- Length of service is assumed to be 10 years.
- Assumes no bonuses from growth, nor asset-based bonuses or other behavior-based awards.
Excludes voluntary deferral matches, 401(k) matches or profit-sharing contributions unless otherwise noted.
Does not include: T&E expense allowance, discount sharing or ticket charge expense assumptions, small household or small ticket policy assumptions, or value of any options awards.

