Best 2030-35 target-date funds of the decade post losses in 2020

How have the best-performing target-date funds of the decade fared amid recent coronavirus-driven volatility? For clients approaching retirement, one lesson in the space remains a constant: past performance is not indicative of the future returns.

The 20 top-performing target-date funds with target dates of 2030 and 2035, and at least $500 million in assets under management, posted an average 10-year gain of roughly 9%, Morningstar Direct data show. But so far this year, the 20 target-date funds posted a near 1.5% loss.

For comparison, index trackers like the SPDR S&P 500 ETF Trust (SPY) and the SPDR Dow Jones Industrial Average ETF Tracker (DIA) posted 10-year gains of 13.92% and 13.17%, respectively. The SPY and DIA have posted year-to-date losses of 0.31% and 4.31%, respectively.

“Looking at the performance differential, it's primarily made up of asset allocation differences,” says Marc Pfeffer, CIO of CLS Investments, adding that the target-date funds with the best 10-year returns have “less international and more growth, versus domestic and value, and those have been both in favor over the last decade, year in and year out. As I often tell people, asset allocation leaders — in terms of what works and what doesn’t work — changes.”

The leaders — from firms like Capital Group, T. Rowe Price and Vanguard — carried an average net expense ratio of 0.58%. That’s more than 20 basis points higher than the average expense ratio among target-date mutual funds in 2019, according to ICI’s latest fee report. It’s also 10 basis points higher than the broader industry’s average of 0.45%, according to Morningstar’s most recent annual fee survey.

For comparison, the Vanguard Target Retirement 2030 Investor (VTHRX) has a 14 basis point expense ratio, 10-year gain of 9.17% and YTD loss of 0.74%, data show.

“I think the expense ratio matters here, but you should also be more importantly looking at their investment styles,” Pfeffer says. “Every client's risk tolerance is different and every advisor should be customizing and knowing what that is — they have to explain the details.”

Scroll through to see the 20 target-date 2030-35 category funds with the best 10-year returns through June 10. Funds with less than $500 million in AUM and with investment minimums over $100,000 were excluded, as were leveraged and institutional funds. Assets and expense ratios, as well as year-to-date and one-, three-, five- and 10-year returns and net flows are listed for each. Flow data as of June 1. The data show each fund's primary share class. All data is from Morningstar Direct.

FP0061220_20 copy.png

Voya Solution 2035 Portfolio S (ISQSX)

YTD Net Flows (millions): ($8.66)
1-Yr. Net Flows (millions): ($30.40)
3-Yr. Net Flows (millions): ($119.48)
5-Yr. Net Flows (millions): ($220.84)
10-Yr. Net Flows (millions): ($429.22)
1-Yr. Return: 5.29%
3-Yr. Annualized Return: 5.59%
5-Yr. Annualized Return: 5.47%
FP0061220_19 copy.png

American Century One Choice 2035 Investor (ARYIX)

YTD Net Flows (millions): ($91.05)
1-Yr. Net Flows (millions): ($183.61)
3-Yr. Net Flows (millions): ($392.61)
5-Yr. Net Flows (millions): ($356.86)
10-Yr. Net Flows (millions): $25.78
1-Yr. Return: 7.29%
3-Yr. Annualized Return: 6.17%
5-Yr. Annualized Return: 5.64%
FP0061220_18 copy.png

Fidelity Advisor Freedom 2030 A (FAFEX)

YTD Net Flows (millions): ($66.12)
1-Yr. Net Flows (millions): ($164.85)
3-Yr. Net Flows (millions): ($477.83)
5-Yr. Net Flows (millions): ($902.39)
10-Yr. Net Flows (millions): ($923.78)
1-Yr. Return: 7.40%
3-Yr. Annualized Return: 6.60%
5-Yr. Annualized Return: 6.34%
FP0061220_17 copy.png

GuideStone Funds MyDestination 2035 Investor (GMHZX)

YTD Net Flows (millions): $13.61
1-Yr. Net Flows (millions): $21.08
3-Yr. Net Flows (millions): $133.30
5-Yr. Net Flows (millions): $121.37
10-Yr. Net Flows (millions): $331.07
1-Yr. Return: 7.03%
3-Yr. Annualized Return: 6.58%
5-Yr. Annualized Return: 5.76%
FP0061220_16 copy.png

JHancock Multi-Index 2035 Preservation 1 (JRYOX)

YTD Net Flows (millions): ($63.37)
1-Yr. Net Flows (millions): ($129.40)
3-Yr. Net Flows (millions): ($364.22)
5-Yr. Net Flows (millions): ($317.08)
10-Yr. Net Flows (millions): $535.47
1-Yr. Return: 9.04%
3-Yr. Annualized Return: 7.05%
5-Yr. Annualized Return: 6.60%
FP0061220_15 copy.png

Schwab Target 2030 (SWDRX)

YTD Net Flows (millions): ($60.56)
1-Yr. Net Flows (millions): ($78.63)
3-Yr. Net Flows (millions): ($99.80)
5-Yr. Net Flows (millions): ($67.08)
10-Yr. Net Flows (millions): $193.07
1-Yr. Return: 7.18%
3-Yr. Annualized Return: 6.06%
5-Yr. Annualized Return: 5.80%
FP0061220_14 copy.png

Fidelity Advisor Freedom 2035 A (FATHX)

YTD Net Flows (millions): ($45.78)
1-Yr. Net Flows (millions): ($117.28)
3-Yr. Net Flows (millions): ($365.50)
5-Yr. Net Flows (millions): ($674.55)
10-Yr. Net Flows (millions): ($564.83)
1-Yr. Return: 7.06%
3-Yr. Annualized Return: 6.76%
5-Yr. Annualized Return: 6.61%
FP0061220_13 copy.png

Great-West Lifetime 2035 Service (MXLLX)

YTD Net Flows (millions): ($102.97)
1-Yr. Net Flows (millions): ($221.91)
3-Yr. Net Flows (millions): ($578.80)
5-Yr. Net Flows (millions): ($676.32)
10-Yr. Net Flows (millions): ($626.52)
1-Yr. Return: 5.58%
3-Yr. Annualized Return: 5.65%
5-Yr. Annualized Return: 6.15%
FP0061220_12 copy.png

JHancock Multimanager 2030 Lifetime 1 (JLFOX)

YTD Net Flows (millions): ($40.91)
1-Yr. Net Flows (millions): ($133.17)
3-Yr. Net Flows (millions): ($373.27)
5-Yr. Net Flows (millions): ($619.72)
10-Yr. Net Flows (millions): ($382.91)
1-Yr. Return: 8.64%
3-Yr. Annualized Return: 6.80%
5-Yr. Annualized Return: 6.42%
FP0061220_11 copy.png

Vanguard Target Retirement 2030 Investor (VTHRX)

YTD Net Flows (millions): ($203.06)
1-Yr. Net Flows (millions): $496.84
3-Yr. Net Flows (millions): $4,423.25
5-Yr. Net Flows (millions): $4,196.62
10-Yr. Net Flows (millions): $17,953.18
1-Yr. Return: 8.08%
3-Yr. Annualized Return: 6.94%
5-Yr. Annualized Return: 6.53%
FP0061220_10 copy.png

MFS Lifetime 2030 R3 (MLTHX)

YTD Net Flows (millions): $7.15
1-Yr. Net Flows (millions): $14.99
3-Yr. Net Flows (millions): $32.65
5-Yr. Net Flows (millions): $59.58
10-Yr. Net Flows (millions): $102.20
1-Yr. Return: 6.21%
3-Yr. Annualized Return: 6.66%
5-Yr. Annualized Return: 6.38%
FP0061220_9 copy.png

Fidelity Freedom Index 2035 Investor (FIHFX)

YTD Net Flows (millions): $260.21
1-Yr. Net Flows (millions): $1,003.23
3-Yr. Net Flows (millions): $1,957.31
5-Yr. Net Flows (millions): $1,565.00
10-Yr. Net Flows (millions): $2,584.05
1-Yr. Return: 8.49%
3-Yr. Annualized Return: 7.95%
5-Yr. Annualized Return: 7.36%
FP0061220_8 copy.png

JHancock Multimanager 2035 Lifetime 1 (JLHOX)

YTD Net Flows (millions): ($39.15)
1-Yr. Net Flows (millions): ($95.08)
3-Yr. Net Flows (millions): ($299.44)
5-Yr. Net Flows (millions): ($508.86)
10-Yr. Net Flows (millions): ($276.13)
1-Yr. Return: 8.67%
3-Yr. Annualized Return: 6.92%
5-Yr. Annualized Return: 6.60%
FP0061220_7.png

Vanguard Target Retirement 2035 Inv (VTTHX)

YTD Net Flows (millions): ($33.37)
1-Yr. Net Flows (millions): $656.33
3-Yr. Net Flows (millions): $3,722.69
5-Yr. Net Flows (millions): $2,081.34
10-Yr. Net Flows (millions): $12,105.21
1-Yr. Return: 7.91%
3-Yr. Annualized Return: 7.08%
5-Yr. Annualized Return: 6.69%
FP0061220_6 copy.png

Mutual of America 2030 Retirement (MURIX)

YTD Net Flows (millions): $4.41
1-Yr. Net Flows (millions): $70.65
3-Yr. Net Flows (millions): $243.31
5-Yr. Net Flows (millions): $354.27
10-Yr. Net Flows (millions): N/A
1-Yr. Return: 6.08%
3-Yr. Annualized Return: 6.21%
5-Yr. Annualized Return: 6.52%
FP0061220_5 copy.png

T. Rowe Price Retirement 2030 (TRRCX)

YTD Net Flows (millions): ($934.23)
1-Yr. Net Flows (millions): ($2,434.29)
3-Yr. Net Flows (millions): ($9,994.68)
5-Yr. Net Flows (millions): ($9,435.73)
10-Yr. Net Flows (millions): ($2,759.01)
1-Yr. Return: 7.86%
3-Yr. Annualized Return: 7.03%
5-Yr. Annualized Return: 6.83%
FP0061220_4 copy.png

Mutual of America 2035 Retirement (MURJX)

YTD Net Flows (millions): $16.22
1-Yr. Net Flows (millions): $66.68
3-Yr. Net Flows (millions): $207.00
5-Yr. Net Flows (millions): $298.53
10-Yr. Net Flows (millions): N/A
1-Yr. Return: 5.55%
3-Yr. Annualized Return: 6.16%
5-Yr. Annualized Return: 6.58%
FP0061220_3 copy.png

T. Rowe Price Retirement 2035 (TRRJX)

YTD Net Flows (millions): ($431.80)
1-Yr. Net Flows (millions): ($1,323.25)
3-Yr. Net Flows (millions): ($6,174.73)
5-Yr. Net Flows (millions): ($5,053.71)
10-Yr. Net Flows (millions): ($278.55)
1-Yr. Return: 7.94%
3-Yr. Annualized Return: 7.20%
5-Yr. Annualized Return: 7.01%
FP0061220_2 copy.png

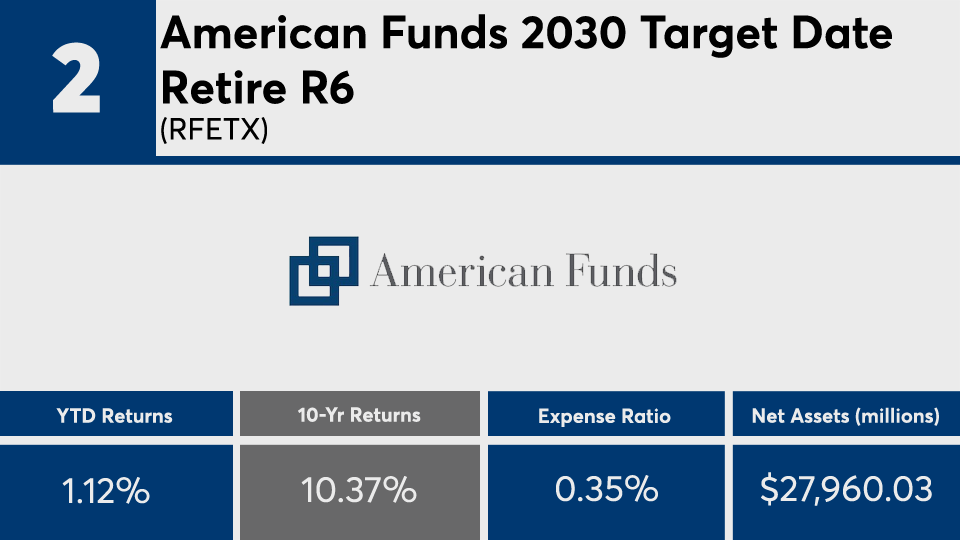
American Funds 2030 Target Date Retire R6 (RFETX)

YTD Net Flows (millions): $908.09
1-Yr. Net Flows (millions): $3,165.17
3-Yr. Net Flows (millions): $9,433.02
5-Yr. Net Flows (millions): $12,230.77
10-Yr. Net Flows (millions): $13,288.71
1-Yr. Return: 9.84%
3-Yr. Annualized Return: 7.98%
5-Yr. Annualized Return: 7.43%
FP0061220_1 copy.png

American Funds 2035 Target Date Retire R6 (RFFTX)

YTD Net Flows (millions): $965.22
1-Yr. Net Flows (millions): $2,776.45
3-Yr. Net Flows (millions): $8,141.07
5-Yr. Net Flows (millions): $10,197.09
10-Yr. Net Flows (millions): $10,850.83
1-Yr. Return: 10.43%
3-Yr. Annualized Return: 8.68%
5-Yr. Annualized Return: 8.06%
MORE FROM FINANCIAL PLANNING