The 20 ETFs with the biggest 15-year inflows net $809B in AUM

It has been about three decades since the first ETF became available to investors. Since then, the industry has grown to more than $4 trillion.

Over the last 15 years, the 20 ETFs with the largest net inflows, and at least $100 million in assets under management, brought in a combined $808.93 billion, Morningstar Direct data show. In the past year, the same funds had net inflows of roughly $95 billion.

Upon deeper analysis, the lineup of flow leaders shows just how entrenched the usage of ETF model portfolios has become by advisors and their clients over the past decade-and-a-half, says Donald G. Bennyhoff, investment committee chairman and director of investor education at Portfolio Solutions, a full-service, fee-only financial advisory firm.

“When viewed in aggregate, most of these funds would be very common holdings in a broadly diversified portfolio of stocks and bonds,” Bennyhoff explains. “ETF model portfolios have become a valuable tool for advisors, enabling them to shift their time and attention from portfolio management to relationship management. Time no longer spent building portfolios is time available to dedicate to better knowing and serving their clients.”

The leaders, most of which launched several years after the SPDR S&P 500 (SPY) became the industry’s first ETF to start trading in 1993, have generated an average 15-year return of around 7.8%, data show. Over the last year, the lineup of both stock and bond funds notched an average gain of more than 25%.

When compared with the broader industry, index trackers such as SPY and the SPDR Dow Jones Industrial Average ETF (DIA) had 15-year returns of 9.68% and 9.78%, respectively, data show. In the past 12 months, SPY and DIA have seen gains of 29.41% and 23.21%, respectively.

In bonds, the iShares Core U.S. Aggregate Bond ETF (AGG) had a 15-year return of 4.21% and one-year return of 0.48%.

With fees ranging from as low as three basis points to as high as 0.32%, it’s easy to see why so much client cash has found its way to the funds in this ranking. The top 20 carried an average net expense ratio of 11 basis points, just a fraction of the 0.45% investors paid for fund investing in 2019, according to Morningstar’s most recent annual fee survey.

Despite the low fees, the funds’ overall performance figures show why it’s important to have a detailed discussion with clients about the relationship between returns and long-term goals and objectives, says Amy Magnotta, co-head of discretionary portfolios at Brinker Capital Investments.

“Since the performance of passive ETFs will be in line with performance of the index or specific asset class they track, it will not require conversations regarding reasons for outperformance or underperformance by an active manager,” Magnotta says. “Instead, conversations can be tailored to portfolio construction, the potential need for rebalancing, and the suitability of certain asset classes given the client’s goals and risk tolerance, as well as the market environment.”

Scroll through to see the 20 funds, with more than $100 million in AUM, and the biggest month-end 15-year net flows through March 1. Assets and average expense ratios, as well as year-to-date, one-, three-, five, 10- and 15-year returns through March 3 are also listed for each. The data show each fund's primary share class. All data is from Morningstar Direct.
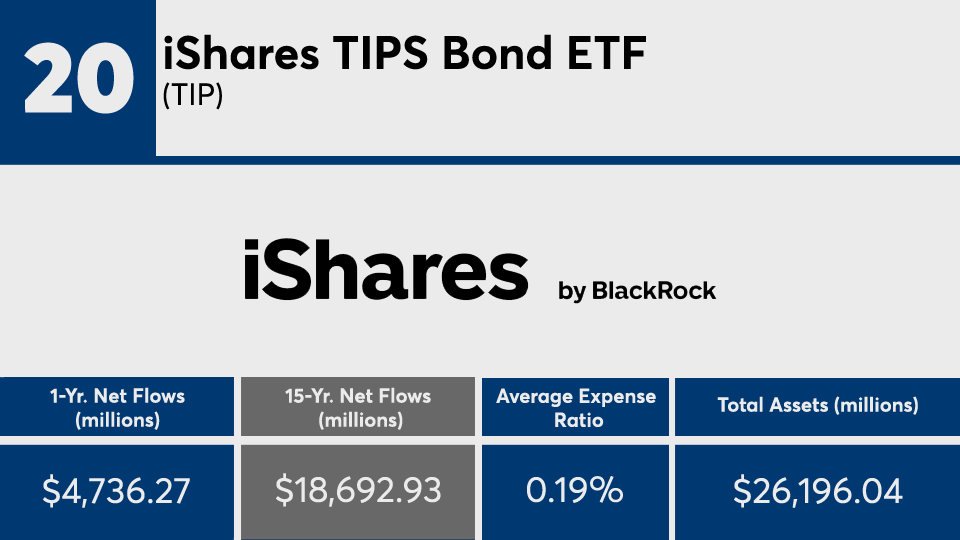
FP030821_20 copy.png

iShares TIPS Bond ETF (TIP)

YTD Return: -1.58%
1-Yr. Return: 4.74%
3-Yr. Annualized Return: 5.8%
5-Yr. Annualized Return: 4.06%
10-Yr. Annualized Return: 3.43%
15-Yr. Annualized Return: 4.11%
YTD Net Flow: (millions): $1,070.72
3-Yr. Net Flow (millions): ($4.54)
5-Yr. Net Flow (millions): $9,905.78
10-Yr. Net Flow (millions): $4,670.49
Inception Date: Dec. 4, 2003
FP030821_19 copy.png

iShares MSCI EAFE ETF (EFA)

YTD Return: 2.85%
1-Yr. Return: 22.05%
3-Yr. Annualized Return: 5.98%
5-Yr. Annualized Return: 9.31%
10-Yr. Annualized Return: 5.19%
15-Yr. Annualized Return: 4.23%
YTD Net Flow: (millions): $0
3-Yr. Net Flow (millions): ($24,956.33)
5-Yr. Net Flow (millions): ($8,654.37)
10-Yr. Net Flow (millions): $4,389.02
Inception Date: Aug. 14, 2001
FP030821_18 copy.png

iShares Russell 1000 Value ETF (IWD)

YTD Return: 6.71
1-Yr. Return: 22.11
3-Yr. Annualized Return: 8.85
5-Yr. Annualized Return: 11.35
10-Yr. Annualized Return: 10.36
15-Yr. Annualized Return: 7.29
YTD Net Flow: (millions): 219.57
3-Yr. Net Flow (millions): 2,890.21
5-Yr. Net Flow (millions): 6,338.96
10-Yr. Net Flow (millions): 14,546.28
Inception Date: May 22, 2000
FP030821_17 copy.png

Vanguard Small-Cap ETF (VB)

YTD Return: 8.56%
1-Yr. Return: 43.66%
3-Yr. Annualized Return: 14.48%
5-Yr. Annualized Return: 16.14%
10-Yr. Annualized Return: 12.17%
15-Yr. Annualized Return: 9.79%
YTD Net Flow: (millions): $1,682.83
3-Yr. Net Flow (millions): $8,923.81
5-Yr. Net Flow (millions): $14,394.33
10-Yr. Net Flow (millions): $18,906.92
Inception Date: Jan. 26, 2004
FP030821_16 copy.png

iShares Core S&P Total US Stock Market ETF (ITOT)

YTD Return: 2.89%
1-Yr. Return: 33.45%
3-Yr. Annualized Return: 15.15%
5-Yr. Annualized Return: 16.61%
10-Yr. Annualized Return: 13.44%
15-Yr. Annualized Return: 9.83%
YTD Net Flow: (millions): $1,170.38
3-Yr. Net Flow (millions): $11,587.19
5-Yr. Net Flow (millions): $19,263.94
10-Yr. Net Flow (millions): $21,728.17
Inception Date: Jan. 20, 2004
FP030821_15 copy.png

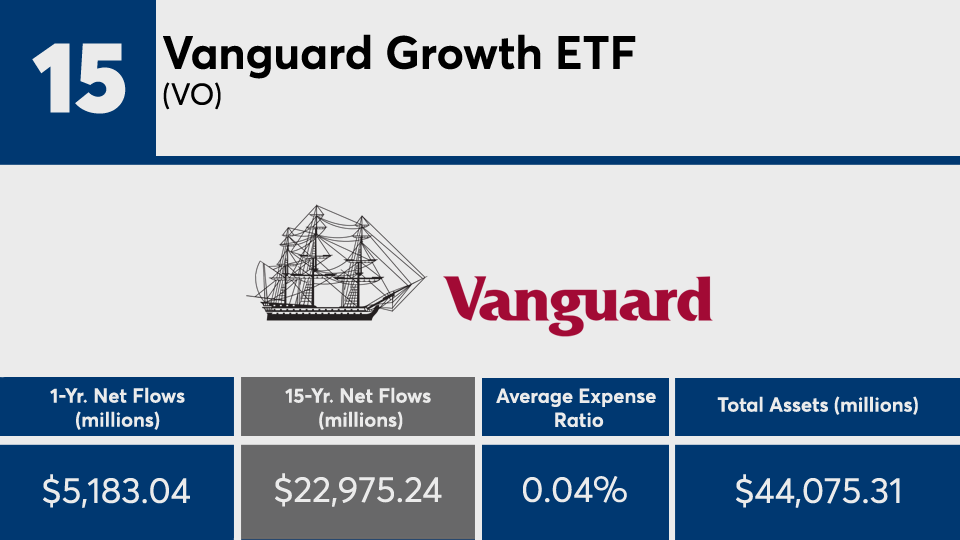
Vanguard Mid-Cap ETF (VO)

YTD Return: 4.36%
1-Yr. Return: 33.47%
3-Yr. Annualized Return: 13.59%
5-Yr. Annualized Return: 14.85%
10-Yr. Annualized Return: 12.12%
15-Yr. Annualized Return: 9.59%
YTD Net Flow: (millions): $598.81
3-Yr. Net Flow (millions): $9,708.57
5-Yr. Net Flow (millions): $14,658.78
10-Yr. Net Flow (millions): $21,527.71
Inception Date: Jan. 26, 2004
FP030821_14 copy.png

iShares Core S&P Mid-Cap ETF (IJH)

YTD Return: 8.91%
1-Yr. Return: 38.75%
3-Yr. Annualized Return: 11.86%
5-Yr. Annualized Return: 14.3%
10-Yr. Annualized Return: 11.55%
15-Yr. Annualized Return: 9.65%
YTD Net Flow: (millions): ($606.72)
3-Yr. Net Flow (millions): $174.06
5-Yr. Net Flow (millions): $9,016.03
10-Yr. Net Flow (millions): $18,513.63
Inception Date: May 22, 2000
FP030821_13 copy.png

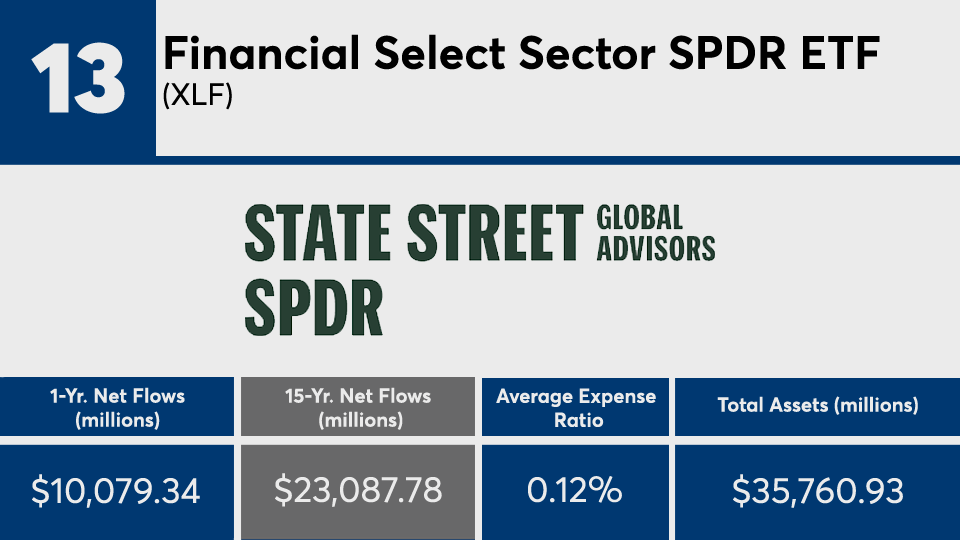
Financial Select Sector SPDR ETF (XLF)

YTD Return: 13.53%
1-Yr. Return: 27.77%
3-Yr. Annualized Return: 7.87%
5-Yr. Annualized Return: 15.51%
10-Yr. Annualized Return: 11.51%
15-Yr. Annualized Return: 3.72%
YTD Net Flow: (millions): $7,051.40
3-Yr. Net Flow (millions): ($276.6)
5-Yr. Net Flow (millions): $6,986.26
10-Yr. Net Flow (millions): $11,992.43
Inception Date: Dec. 16, 1998
FP030821_12 copy.png

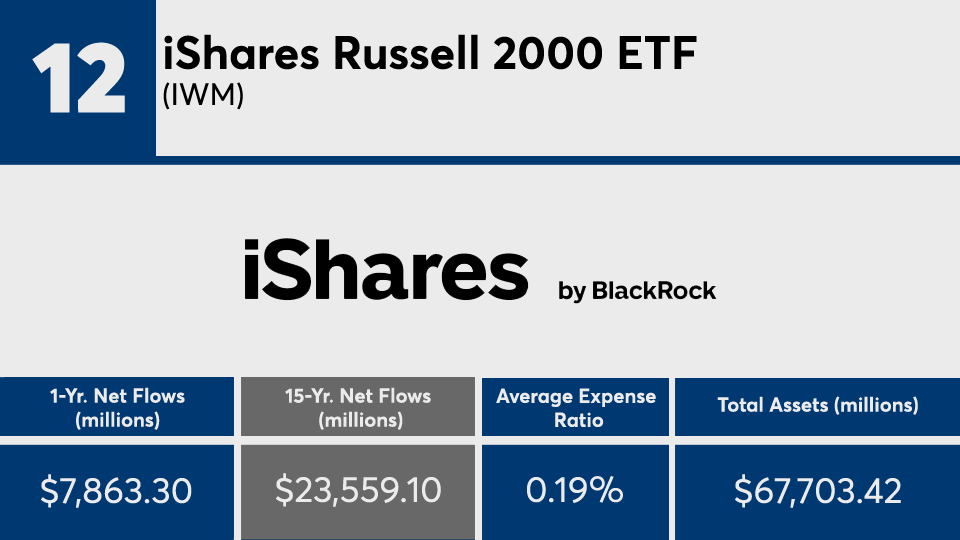
iShares Russell 2000 ETF (IWM)

YTD Return: 11.89%
1-Yr. Return: 50.35%
3-Yr. Annualized Return: 14.39%
5-Yr. Annualized Return: 17.02%
10-Yr. Annualized Return: 11.83%
15-Yr. Annualized Return: 9.06%
YTD Net Flow: (millions): $2,250.69
3-Yr. Net Flow (millions): $9,546.48
5-Yr. Net Flow (millions): $14,639.30
10-Yr. Net Flow (millions): $17,459.20
Inception Date: May 22, 2000
FP030821_11 copy.png

Vanguard Growth ETF (VUG)

YTD Return: -1.65%
1-Yr. Return: 40.48%
3-Yr. Annualized Return: 21.07%
5-Yr. Annualized Return: 20.79%
10-Yr. Annualized Return: 15.9%
15-Yr. Annualized Return: 11.95%
YTD Net Flow: (millions): ($687.31)
3-Yr. Net Flow (millions): $6,253.26)
5-Yr. Net Flow (millions): $10,315.49)
10-Yr. Net Flow (millions): $19,724.92)
Inception Date: Jan 26, 2004
FP030821_10 copy.png

Vanguard Real Estate ETF (VNQ)

YTD Return: 2.26%
1-Yr. Return: -0.47%
3-Yr. Annualized Return: 10.11%
5-Yr. Annualized Return: 6.08%
10-Yr. Annualized Return: 8.33%
15-Yr. Annualized Return: 6.44%
YTD Net Flow: (millions): $1,556.55
3-Yr. Net Flow (millions): $444.15
5-Yr. Net Flow (millions): $4,278.57
10-Yr. Net Flow (millions): $18,703.18
Inception Date: Sept. 23, 2004
FP030821_09 copy.png

SPDR Gold Shares (GLD)

YTD Return: -9.53%
1-Yr. Return: 3.86%
3-Yr. Annualized Return: 8.56%
5-Yr. Annualized Return: 5.61%
10-Yr. Annualized Return: 1.43%
15-Yr. Annualized Return: 7.24%
YTD Net Flow: (millions): ($5,988.74)
3-Yr. Net Flow (millions): $14,127.66
5-Yr. Net Flow (millions): $16,953.71
10-Yr. Net Flow (millions): $294.21
Inception Date: Nov. 18, 2004
FP030821_08 copy.png

iShares Core S&P Small-Cap ETF (IJR)

YTD Return: 16.11%
1-Yr. Return: 48.19%
3-Yr. Annualized Return: 13.29%
5-Yr. Annualized Return: 16.11%
10-Yr. Annualized Return: 12.98%
15-Yr. Annualized Return: 9.87%
YTD Net Flow: (millions): $1,481.18
3-Yr. Net Flow (millions): $13,011.88
5-Yr. Net Flow (millions): $24,476.57
10-Yr. Net Flow (millions): $29,566.59
Inception Date:
FP030821_07 copy.png

iShares iBoxx $ Investment Grade Corporate Bond ETF (LQD)

YTD Return: -4.48%
1-Yr. Return: 1.23%
3-Yr. Annualized Return: 7.47%
5-Yr. Annualized Return: 6.11%
10-Yr. Annualized Return: 5.6%
15-Yr. Annualized Return: 5.69%
YTD Net Flow: (millions): ($7,689.34)
3-Yr. Net Flow (millions): $6,965.07
5-Yr. Net Flow (millions): $14,520.02
10-Yr. Net Flow (millions): $26,114.90
Inception Date: July 22, 2002
FP030821_06 copy.png

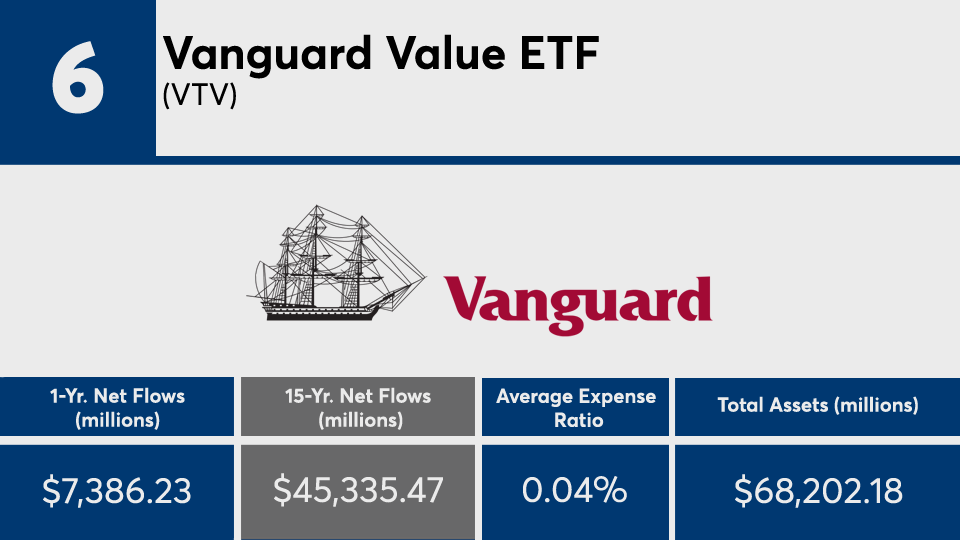
Vanguard Value ETF (VTV)

YTD Return: 6.15%
1-Yr. Return: 21.58%
3-Yr. Annualized Return: 9.15%
5-Yr. Annualized Return: 12.38%
10-Yr. Annualized Return: 11.12%
15-Yr. Annualized Return: 8%
YTD Net Flow: (millions): $2,505.13
3-Yr. Net Flow (millions): $21,298.74
5-Yr. Net Flow (millions): $30,966.41
10-Yr. Net Flow (millions): $41,861.33
Inception Date: Jan. 26, 2004
FP030821_05 copy.png

Vanguard FTSE Emerging Markets ETF (VWO)

YTD Return: 6.64%
1-Yr. Return: 33.79%
3-Yr. Annualized Return: 6.91%
5-Yr. Annualized Return: 13.42%
10-Yr. Annualized Return: 3.95%
15-Yr. Annualized Return: 5.85%
YTD Net Flow: (millions): $2,293.64
3-Yr. Net Flow (millions): $1,180.47
5-Yr. Net Flow (millions): $19,336.96
10-Yr. Net Flow (millions): $25,534.05
Inception Date: March 4, 2005
FP030821_04 copy.png

SPDR S&P 500 ETF Trust (SPY)

YTD Return: 1.94%
1-Yr. Return: 29.41%
3-Yr. Annualized Return: 14.45%
5-Yr. Annualized Return: 16.04%
10-Yr. Annualized Return: 13.31%
15-Yr. Annualized Return: 9.68%
YTD Net Flow: (millions): ($9,023.59)
3-Yr. Net Flow (millions): ($43,418.16)
5-Yr. Net Flow (millions): ($11,100.67)
10-Yr. Net Flow (millions): $16,708.95
Inception Date: Jan. 22, 1993
FP030821_03 copy.png

iShares Core US Aggregate Bond ETF (AGG)

YTD Return: -2.52%
1-Yr. Return: 0.48%
3-Yr. Annualized Return: 5.14%
5-Yr. Annualized Return: 3.45%
10-Yr. Annualized Return: 3.52%
15-Yr. Annualized Return: 4.21%
YTD Net Flow: (millions): $2,758.54
3-Yr. Net Flow (millions): $26,173.48
5-Yr. Net Flow (millions): $50,058.24
10-Yr. Net Flow (millions): $71,318.35
Inception Date: Sept. 22, 2003
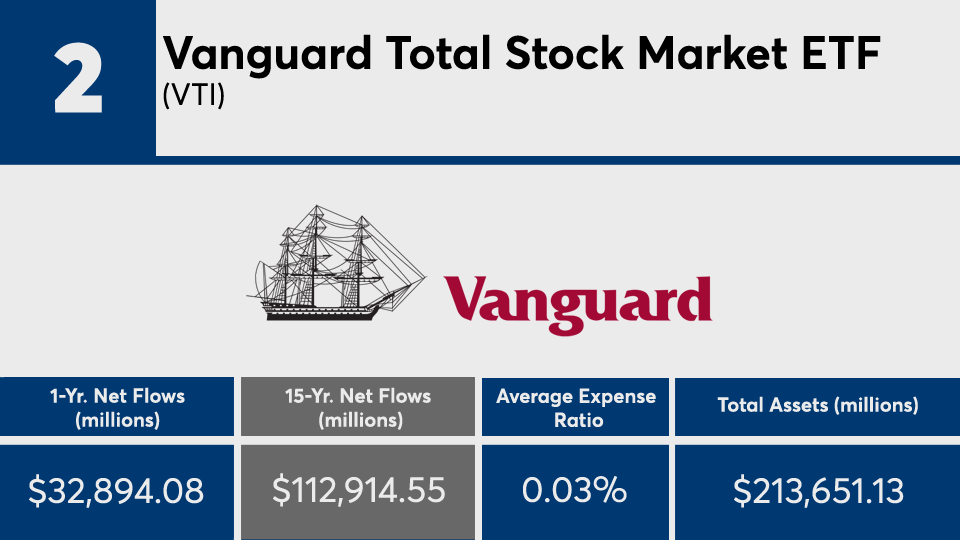
FP030821_02 copy.png

Vanguard Total Stock Market ETF (VTI)

YTD Return: 2.89%
1-Yr. Return: 33.56%
3-Yr. Annualized Return: 15.25%
5-Yr. Annualized Return: 16.68%
10-Yr. Annualized Return: 13.42%
15-Yr. Annualized Return: 9.99%
YTD Net Flow: (millions): $5,269.50
3-Yr. Net Flow (millions): $62,452.14
5-Yr. Net Flow (millions): $77,339.61
10-Yr. Net Flow (millions): $102,465.08
Inception Date: May 24, 2001
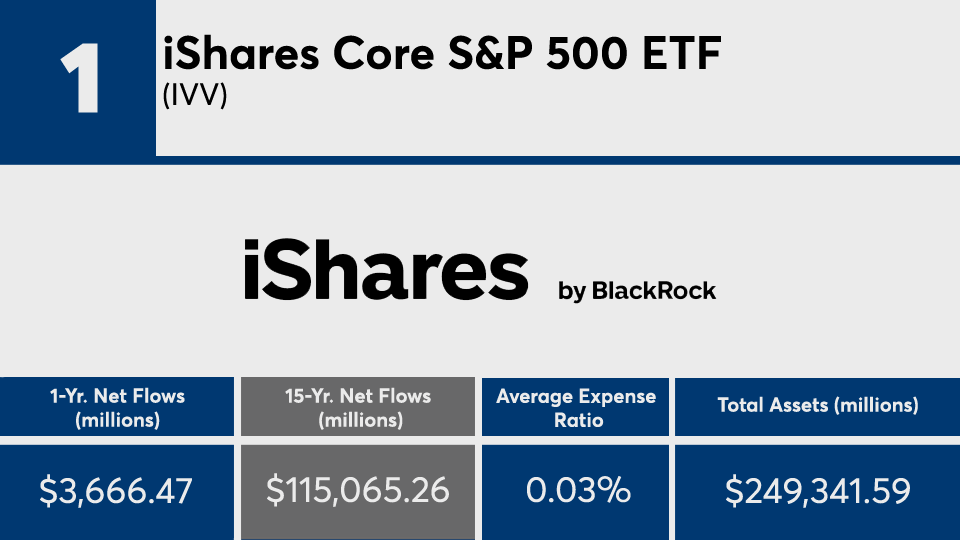
FP030821_01 copy.png

iShares Core S&P 500 ETF (IVV)

YTD Return: 1.95%
1-Yr. Return: 29.41%
3-Yr. Annualized Return: 14.5%
5-Yr. Annualized Return: 16.1%
10-Yr. Annualized Return: 13.37%
15-Yr. Annualized Return: 9.72%
YTD Net Flow: (millions): $6,032.09
3-Yr. Net Flow (millions): $29,200.49
5-Yr. Net Flow (millions): $84,316.91
10-Yr. Net Flow (millions): $106,525.04
Inception Date: May 15, 2000
MORE FROM FINANCIAL PLANNING