Worst active fund returns of 2019

2019 was a banner year for most active funds, with as much as 40% beating their indexes — 53% before fees, data show. However, not every corner of the industry was as fortunate.

The 20 active funds with the worst returns last year eked out an average gain of just 1.07%, according to Morningstar Direct. Munis and ultrashort bond funds account for a majority of the worst-performers, although all were outpaced by their benchmarks; The Bloomberg Barclays Aggregate Bond Index recorded an 8.46% gain, as measured by the iShares Core US Aggregate Bond ETF (AGG); the S&P 500 had a 31.22% gain, as measured by the SPDR S&P 500 ETF Trust (SPY); and the Dow had a 25.01% gain, as measured by the SPDR Dow Jones Industrial Average ETF (DIA), over the same period, Morningstar Direct data show.

“Active bond funds’ success rates split the difference, with slightly more than 40% beating the market net of fees,” Jeffrey Ptak, head of global manager research for Morningstar, wrote in an analysis of last year’s overall active fund performance. “Active muni-bond funds had the highest success rate of all before fees, at 66%, but the second-lowest after fees, reflecting the toll expenses take.”

Unlike the high fees associated with the top-performing active funds, the worst-performers carried an average expense ratio that was much closer to the industry average. At 0.63%, the poorest performers were still costlier than the 48 basis points investors were charged, on average, for fund investing last year, according to Morningstar’s most recent annual fee survey, which reviewed the asset-weighted average expense ratios of all U.S. open-end mutual funds and ETFs.

The industry’s largest overall fund, the $901.9 billion Vanguard Total Stock Market Index Fund Admiral Shares (VTSAX), had a 0.14% expense ratio and a 30.08% return in 2019, data show. Meanwhile, the largest actively managed fund, the $207.4 billion American Funds Growth Fund of America (AGTHX), recorded a 28.12% gain last year, with a 0.65% expense ratio.

“All told, 2019 marked a slight improvement over 2018 but didn’t much buck the long-term trend, which has seen active funds struggle to beat their indexes net of fees,” Ptak wrote.

Scroll through to see the 20 actively managed funds with the biggest gains of 2019. Funds with less than $500 million in AUM and investment minimums over $100,000 were excluded, as were leveraged and institutional funds. Assets and expense ratios for each, as well as three-year net flows and year-to-date returns, are also listed. The data shows each fund's primary share class. All data from Morningstar Direct.

FP021220_20_1.png

Trust For Credit Unions Unions Short Duration TCU (TCUUX)

1-Yr. Annualized Return: 2.50%
5-Yr. Annualized Return: 0.99%
10-Yr. Annualized Return: 0.69%
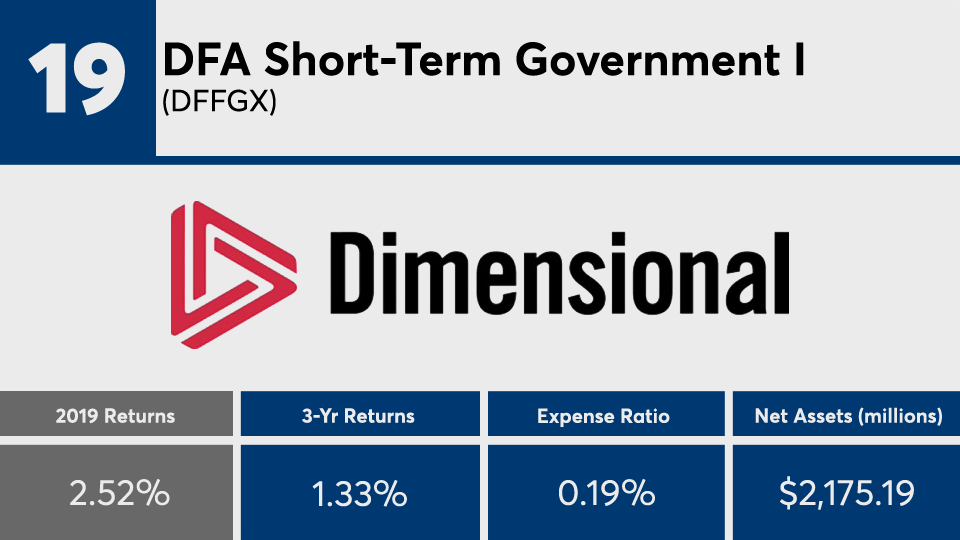
FP021220_19copy.png

DFA Short-Term Government I (DFFGX)

1-Yr. Annualized Return: 2.42%
5-Yr. Annualized Return: 1.21%
10-Yr. Annualized Return: 1.56%
FP021220_18 copy.png

Northern Tax-Advantaged Ultra-Short Fixed Inc (NTAUX)

1-Yr. Annualized Return: 2.46%
5-Yr. Annualized Return: 1.22%
10-Yr. Annualized Return: 1.08%
FP021220_17 copy.png

Vanguard Short-Term Tax-Exempt Adm (VWSUX)

1-Yr. Annualized Return: 2.43%
5-Yr. Annualized Return: 1.27%
10-Yr. Annualized Return: 1.13%
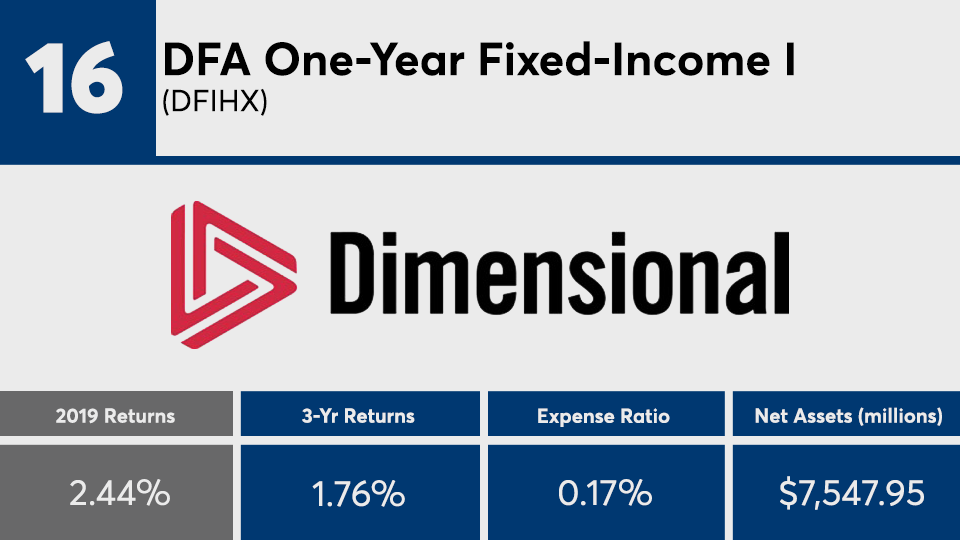
FP021220_16.png

DFA One-Year Fixed-Income I (DFIHX)

1-Yr. Annualized Return: 2.32%
5-Yr. Annualized Return: 1.29%
10-Yr. Annualized Return: 0.95%
FP021220_15.png

Virtus Seix US Government Securities Ultra-Short Bond I (SIGVX)

1-Yr. Annualized Return: 2.39%
5-Yr. Annualized Return: 1.26%
10-Yr. Annualized Return: 1.16%
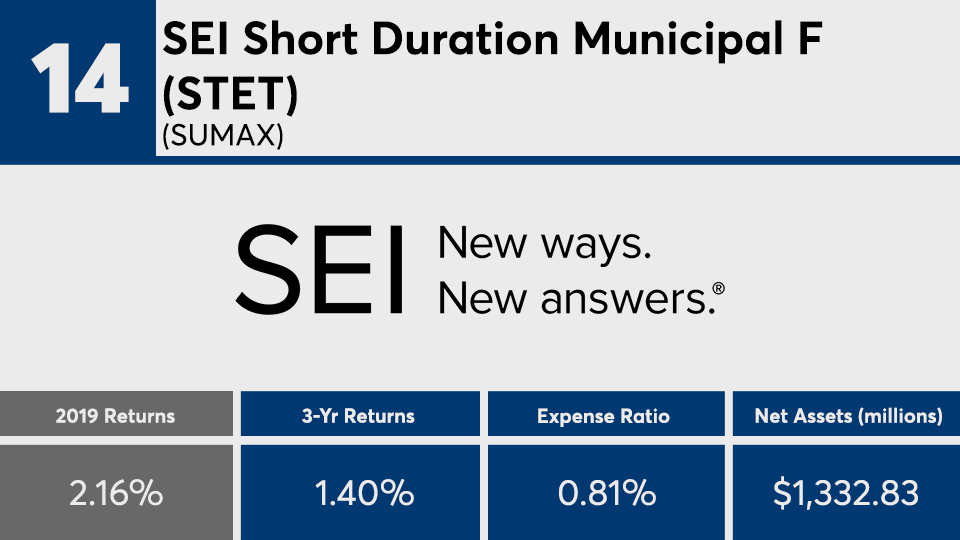
FP021220_14.png

SEI Short Duration Municipal F (STET) (SUMAX)

1-Yr. Annualized Return: 2.24%
5-Yr. Annualized Return: 0.88%
10-Yr. Annualized Return: 0.84%
FP021220_13.png

Strategic Advisers Tax-Sensitive Short Duration (FGNSX)

1-Yr. Annualized Return: 2.16%
5-Yr. Annualized Return: N/A
10-Yr. Annualized Return: N/A
FP021220_12.png

Templeton Global Total Return Adv (TTRZX)

1-Yr. Annualized Return: -1.84%
5-Yr. Annualized Return: 1.86%
10-Yr. Annualized Return: 4.61%
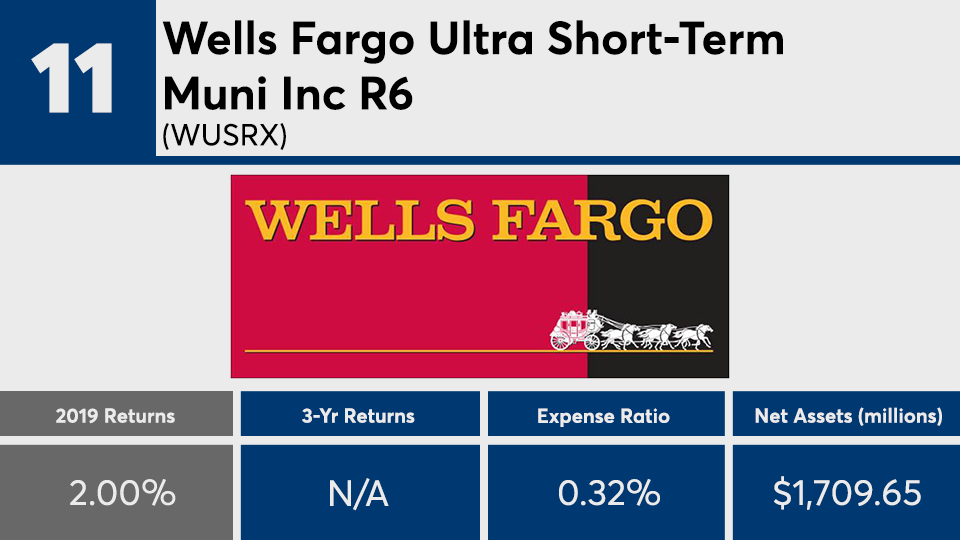
FP021220_11.png

Wells Fargo Ultra Short-Term Muni Inc R6 (WUSRX)

1-Yr. Annualized Return: 1.97%
5-Yr. Annualized Return: N/A
10-Yr. Annualized Return: N/A
FP021220_10.png

Franklin Adjustable US Government Securities A (FISAX)

1-Yr. Annualized Return: 1.97%
5-Yr. Annualized Return: 0.48%
10-Yr. Annualized Return: 0.70%
Load: 2.25%
FP021220_9.png

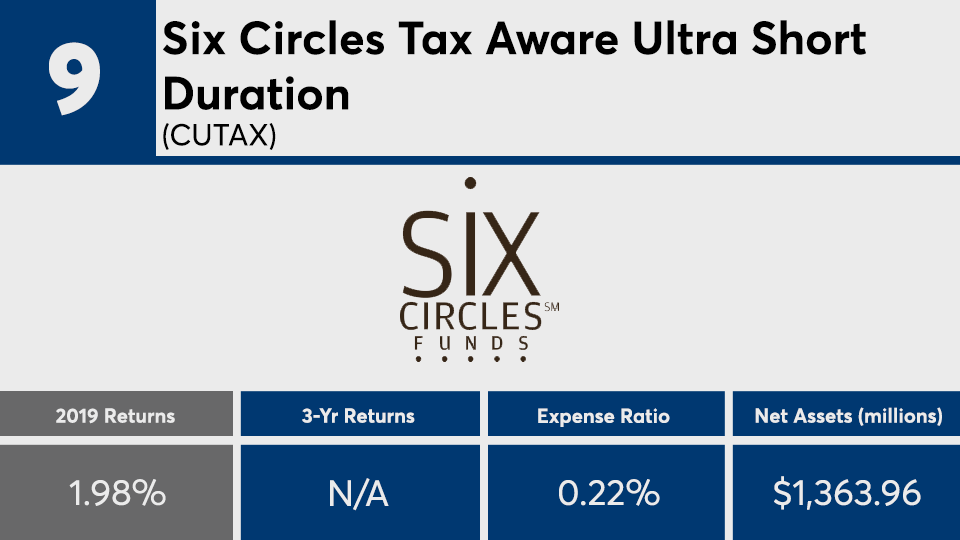
Six Circles Tax Aware Ultra Short Duration (CUTAX)

1-Yr. Annualized Return: 2.05%
5-Yr. Annualized Return: N/A
10-Yr. Annualized Return: N/A
Load: 2.25%
FP021220_8.png

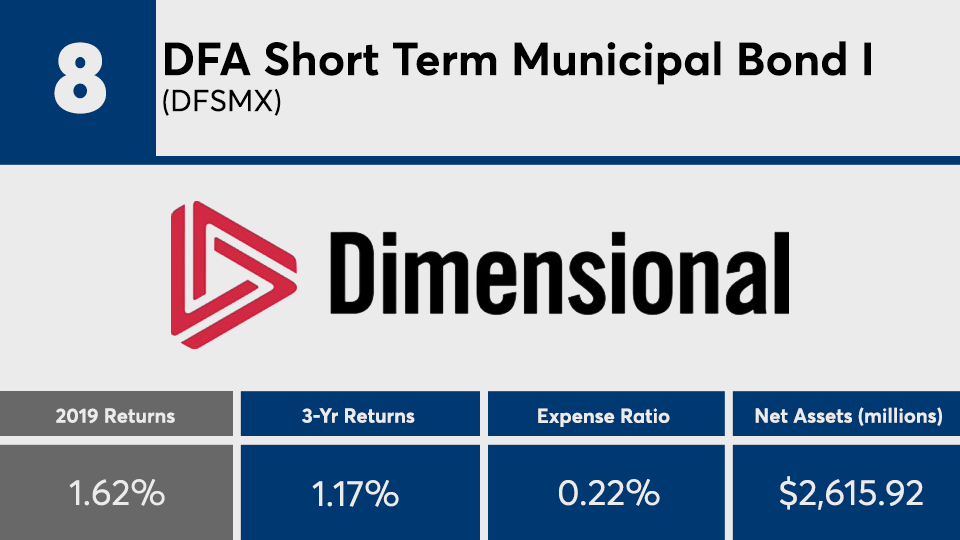
DFA Short Term Municipal Bond I (DFSMX)

1-Yr. Annualized Return: 1.51%
5-Yr. Annualized Return: 0.91%
10-Yr. Annualized Return: 1.02%
FP021220_7.png

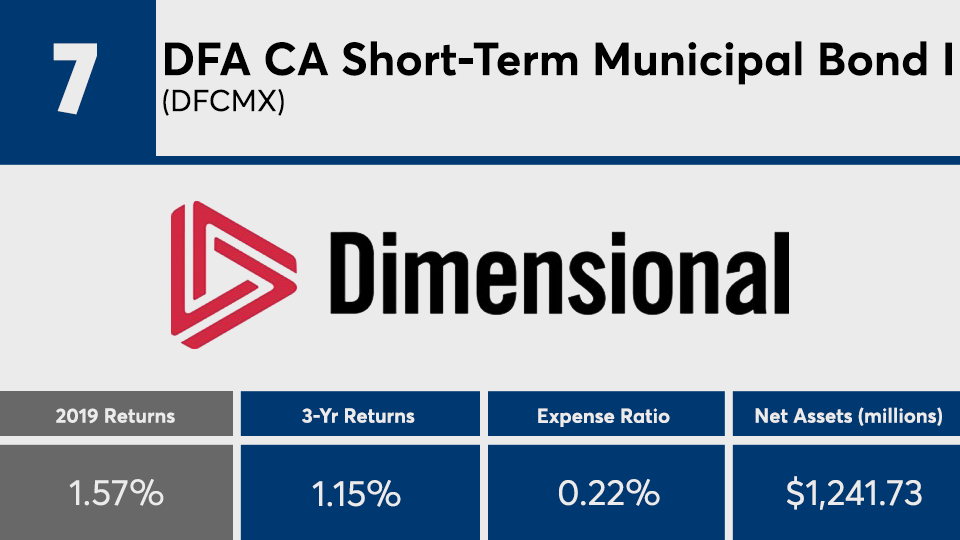
DFA CA Short-Term Municipal Bond I (DFCMX)

1-Yr. Annualized Return: 1.58%
5-Yr. Annualized Return: 0.92%
10-Yr. Annualized Return: 1.10%
FP021220_6.png

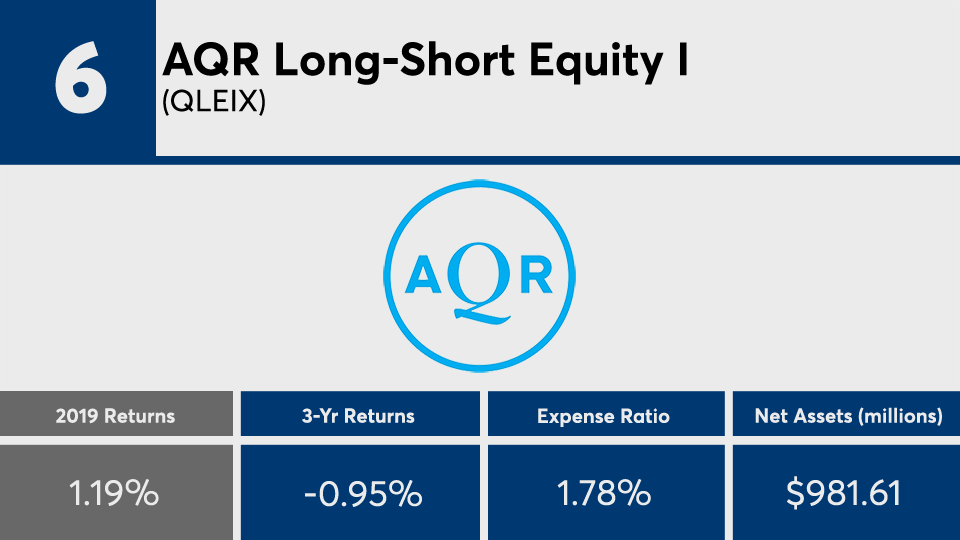
AQR Long-Short Equity I (QLEIX)

1-Yr. Annualized Return: -2.20%
5-Yr. Annualized Return: 4.60%
10-Yr. Annualized Return: N/A
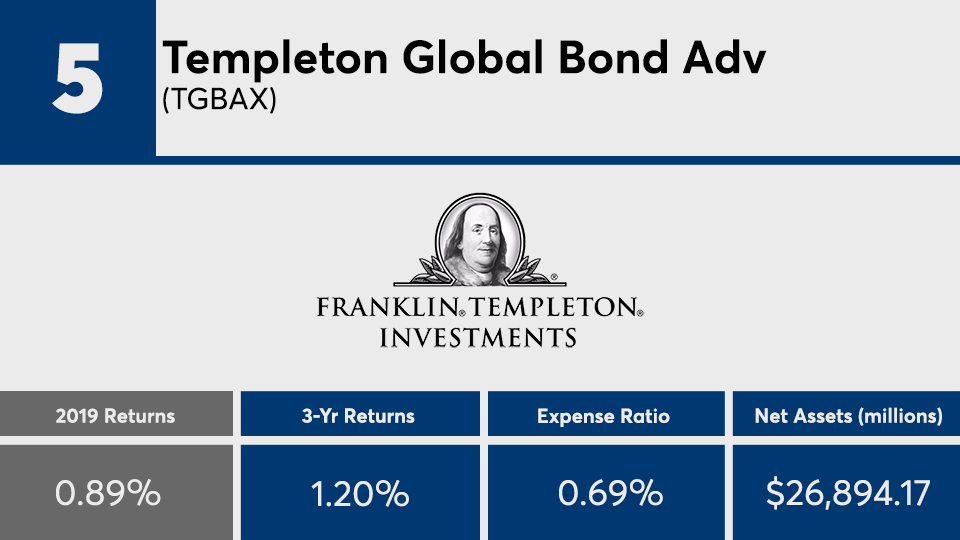
FP021220_5.png

Templeton Global Bond Adv (TGBAX)

1-Yr. Annualized Return: -2.68%
5-Yr. Annualized Return: 1.25%
10-Yr. Annualized Return: 3.59%
FP021220_4.png

T. Rowe Price Dynamic Global Bond Inv (RPIEX)

1-Yr. Annualized Return: -0.97%
5-Yr. Annualized Return: 1.07%
10-Yr. Annualized Return: N/A
FP021220_3.png

Matthews India Investor (MINDX)

1-Yr. Annualized Return: 6.43%
5-Yr. Annualized Return: 3.15%
10-Yr. Annualized Return: 8.15%
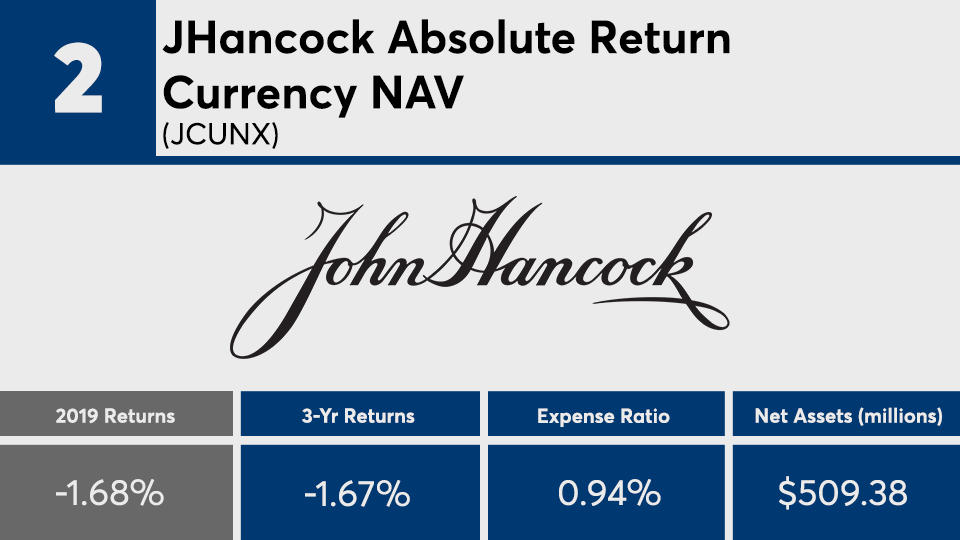
FP021220_2.png

JHancock Absolute Return Currency NAV (JCUNX)

1-Yr. Annualized Return: -0.12%
5-Yr. Annualized Return: 1.50%
10-Yr. Annualized Return: N/A
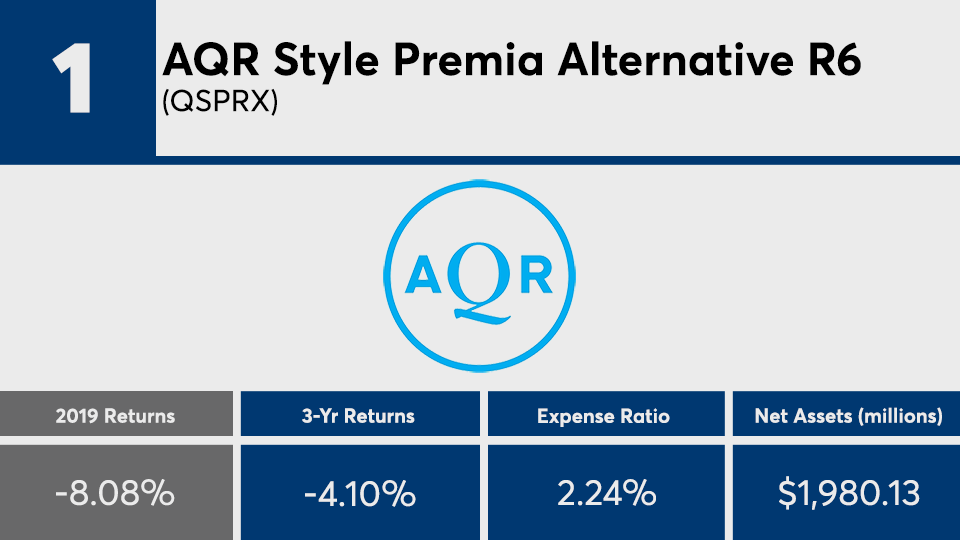
FP021220_1.png

AQR Style Premia Alternative R6 (QSPRX)

1-Yr. Annualized Return: 2.32%
5-Yr. Annualized Return: 1.29%
10-Yr. Annualized Return: 0.95%
MORE FROM FINANCIAL PLANNING