Fixed-income funds have taken hits on multiple fronts this year; and mounting coronavirus fears and an evolving oil price war are only adding to the pressure. For advisors with clients rushing for answers, understanding the differences among bond funds is paramount.
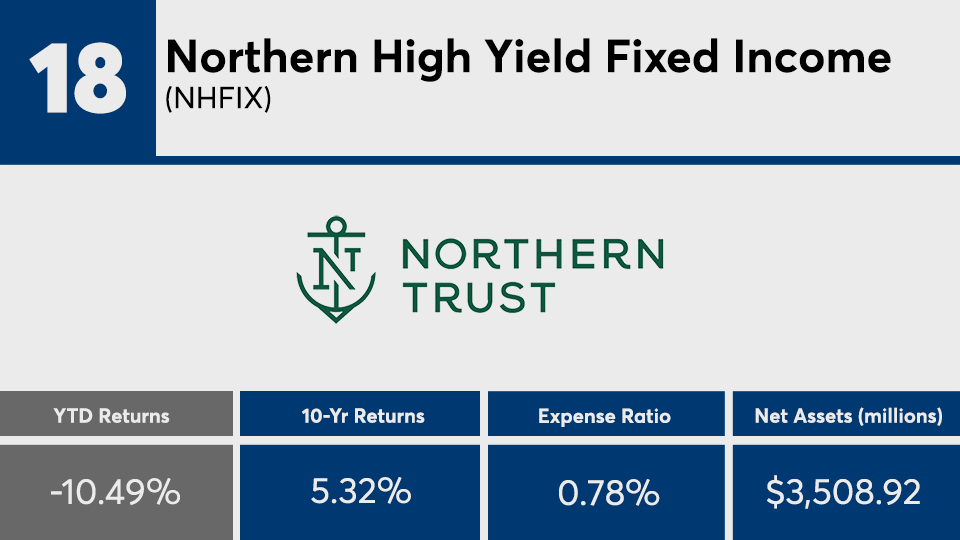
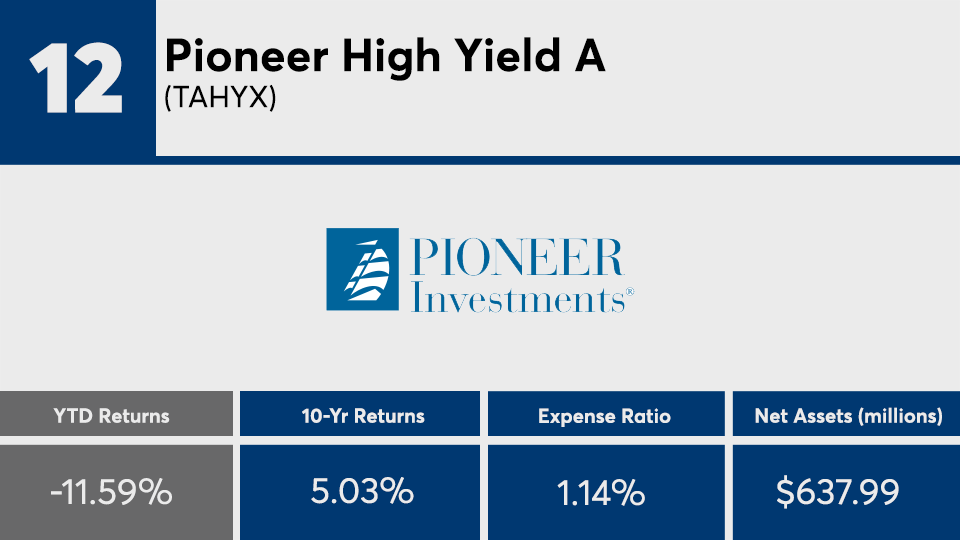
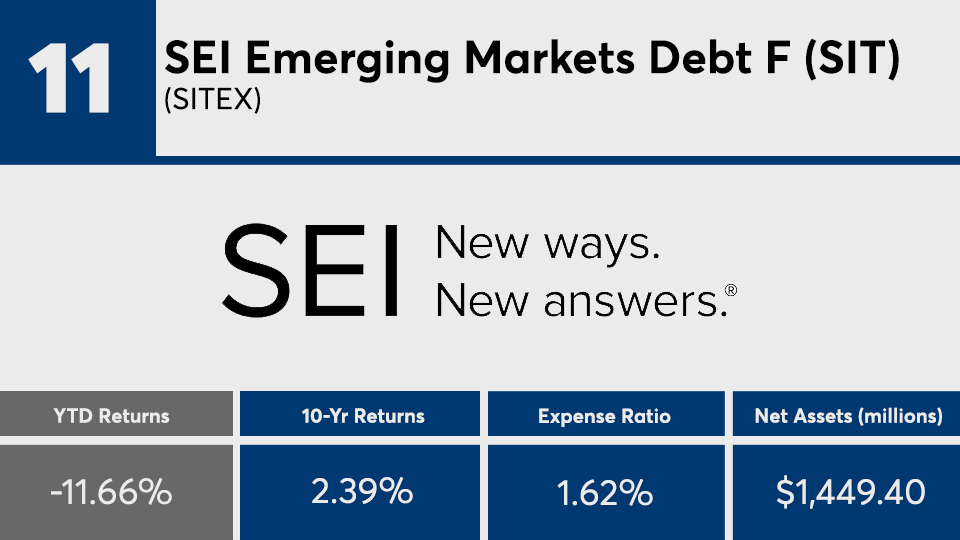
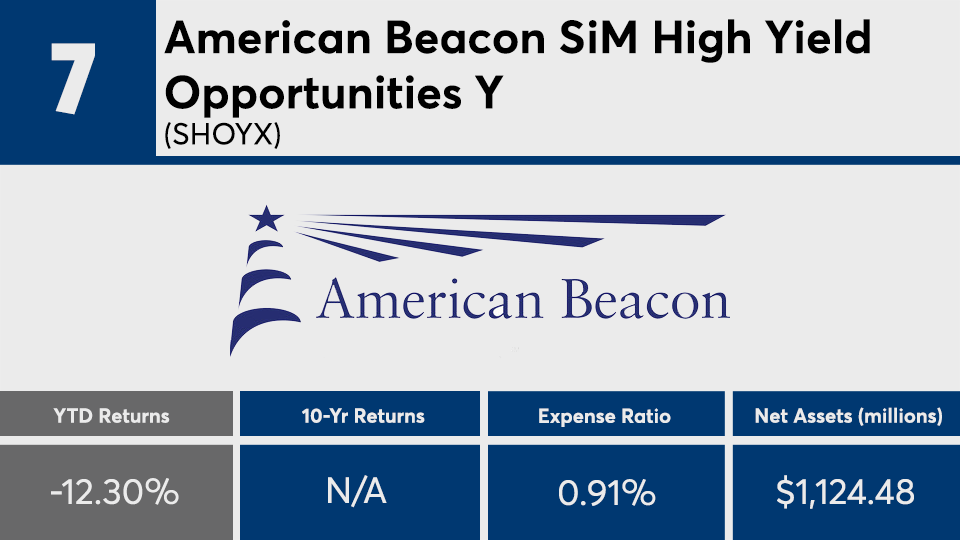
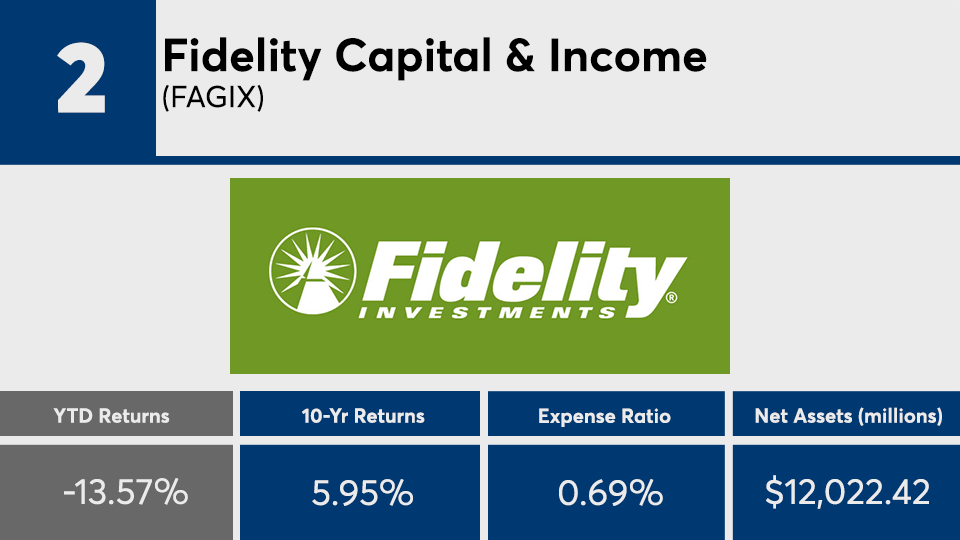
The 20 bond funds with the biggest year-to-date losses still managed to outpace the broader bond market over the long-term, Morningstar Direct data show. With an average YTD loss of nearly 12%, the funds bested the Bloomberg Barclays US Aggregate Bond Index’s 3.57% gain — measured by iShares Core US Aggregate Bond ETF (AGG) — over the last 10 years, data show.
Perhaps no surprise, bond funds that took the biggest hits were invested more heavily in preferred stocks and emerging market debt strategies than their peers, notes Karin Anderson, director of fixed-income manager research at Morningstar.
Compared with funds concentrated on U.S. Treasurys, high-yield has had an especially tough time. “Were now in a very risk averse environment, so it’s no surprise these are taking a big hit on the credit side,” says Karin Anderson, Morningstar’s director of fixed-income manager research. “High-yield strategies were already going to suffer, but add in the effects of the Saudi and Russian oil war going on [and] that really amplifies their losses year-to-date.”
The price of investing in the year’s worst performers was higher than the broader fund industry. At more than 0.75%, the funds were well above the 0.48% investors paid on average, according to Morningstar’s most recent annual fee survey, which reviewed the asset-weighted average expense ratios of all U.S. open-end mutual funds and ETFs.
The industry’s largest bond fund, the $269 billion Vanguard Total Bond Market Index Admiral Shares (VBTLX), which has a 0.05% expense ratio, posted a year-to-date gain of 2.15% and 10-year gain of 3.71%, data show. Meanwhile, the industry’s largest overall fund, the $840.9 billion Vanguard Total Stock Market Index Fund Admiral Shares (VTSAX), which as a 0.14% expense ratio, posted a YTD loss of 27.21% and 10-year gain of 9.32%, data show.
“It would be foolish to time the market. It’s changing every other day,” she says. “The key thing here is to remain focused on cautious rebalancing. This is a time when we need to think about doing that to meet the equity fixed-income target you’ve been focused on. It’s trickier for those closer to retirement, while those early on it’s a great buying opportunity and rebalancing opportunity.”
Scroll through to see the 20 fixed-income funds with the worst year-to-date returns through March 13. Funds with less than $500 million in assets under management and investment minimums over $100,000 were excluded, as were leveraged and institutional funds. Assets and expense ratios are listed for each, as well as one-, three-, five- and 10-year returns. The data show each fund's primary share class. All data from Morningstar Direct.


