The number of registered representatives in the industry fell 2% over the past two years to 630,132, according to a recent report from FINRA.
To be sure, head count has hovered in a fairly narrow band over the past five years or so, but the longer view reveals a steeper decline. From a high point in 2007 of 672,688 advisors in 2007, head count has dropped 6.3%.
The number of firms also slipped over the past two years, although by less than 1%, to 641,997.
These numbers come from the 2018 FINRA Industry Snapshot, a first-ever look at some of the data the regulator collects in the course of its work.
Despite fewer advisors working in fewer places, the industry was able to crank out more revenue over the past two years. The top line rose an impressive 14% industrywide to $309 billion in 2017 from $271 billion in 2015. Expenses, meanwhile also increased 9% to $270 billion in 2017. The net effect was a 69% increase in pretax net income to $38 billion last year.
The report showed that the number of advisors who changed jobs also slightly increased over the past couple years to hit 26,908. But it’s still far off the high mark of 69,000 who jumped ship in 2009 when the financial crisis roiled the markets and recession hampered the economy.
With geographic data, FINRA broke down its data to the branch level, showing which states had the most and fewest branches. Only eight states had more than 5,000 branches: California led the pack with 17,061, and rounding out the top echelon were Texas (11,009); New York (10,536); Florida (10,237); Illinois (7,299); Pennsylvania (7,155), Ohio (64,63) and Michigan (5,115). New Jersey just missed the top grouping with 4,949. Wyoming had the fewest with 145.
“The Snapshot is designed to increase awareness and understanding about the broad range of firms, individuals and trading activity that FINRA oversees,” the regulator said in a statement. “Consistent with the transparency goals of the FINRA360 organizational-improvement initiative, for the first time FINRA is sharing a statistical overview based on the data it collects in the course of its work.”
The FINRA360 initiative is a self-evaluation the regulator announced early last year, with a major focus on its examination program.
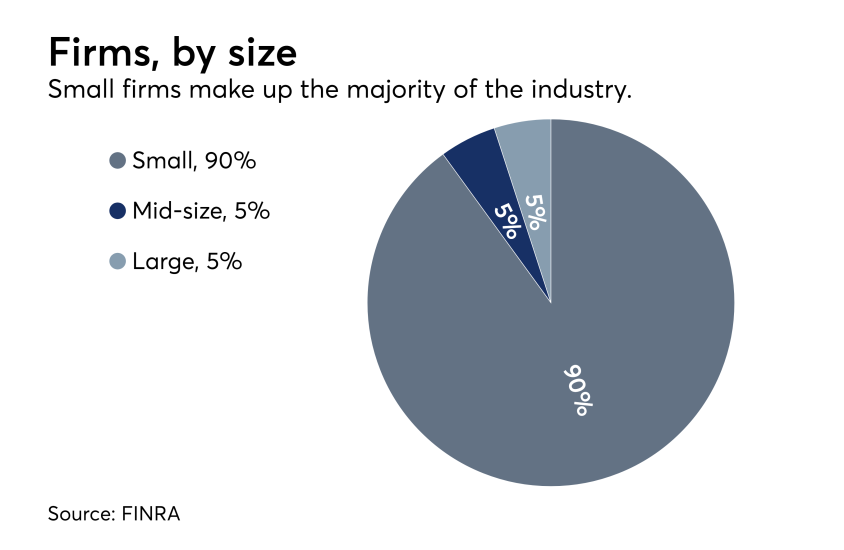
Scroll through to see charts and more data from the 2018 FINRA Industry Snapshot report. All data is from FINRA.


