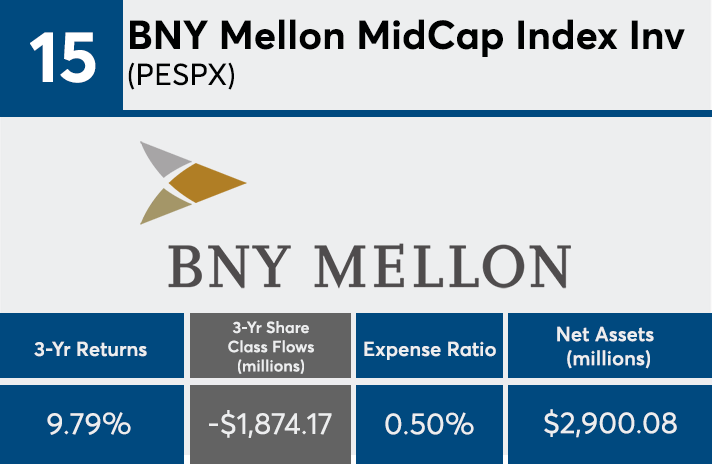
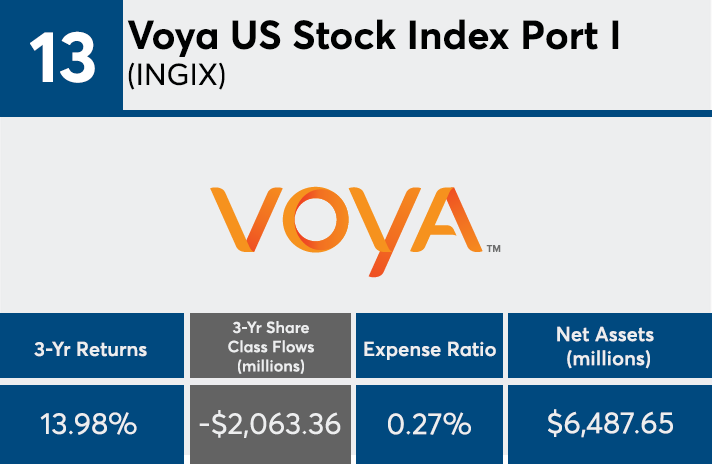
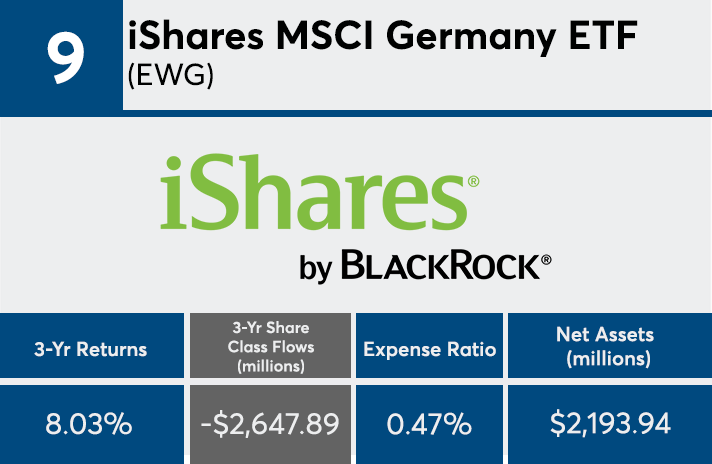
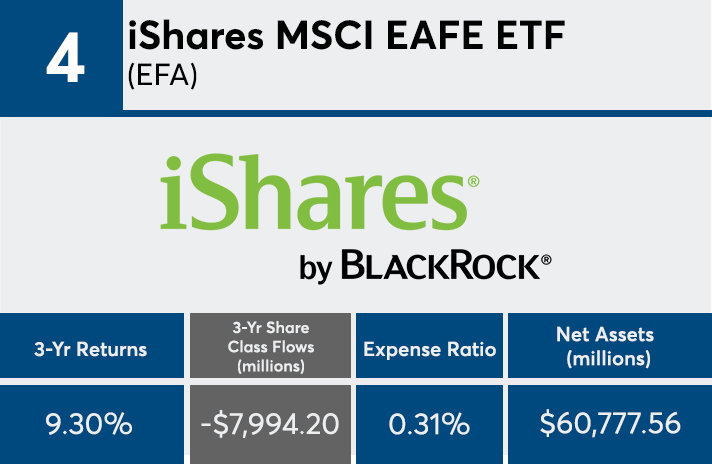
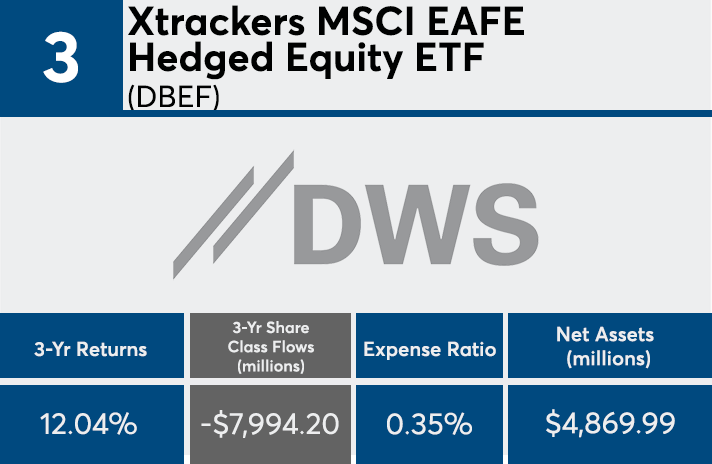
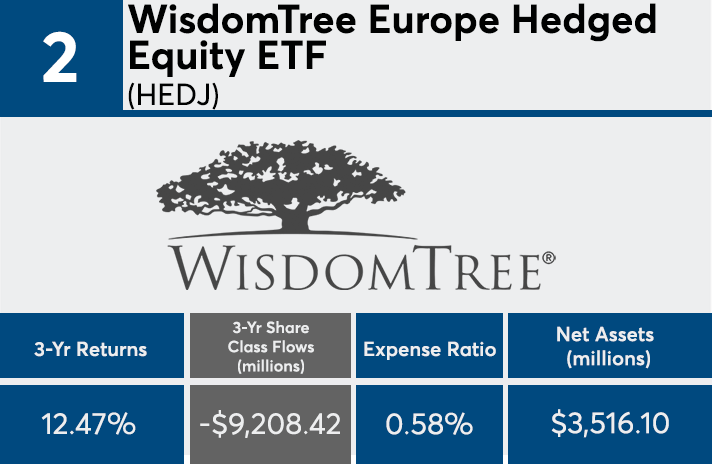
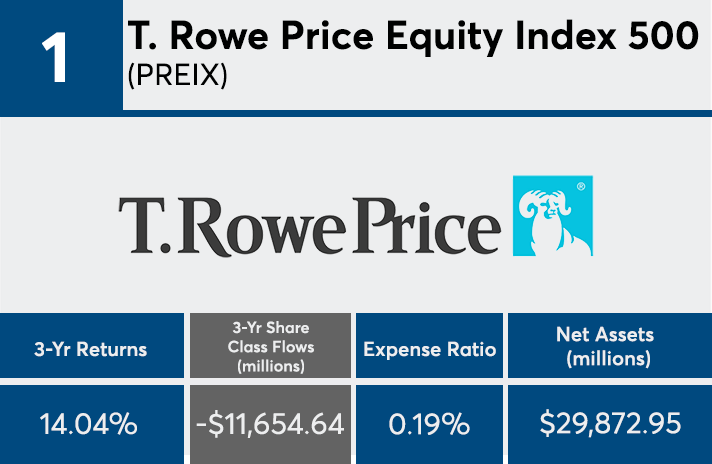
What happens when index funds are priced like the rest of the fund universe? In the case of the largest outflows over three years, the 20 funds at the top of the list lost the equivalent of a third of their combined assets under management.
Deeper analysis of the 20 index funds with the biggest net outflows (with at least $500 million in AUM) provides a look through hyperfocused lens on the fee pressure fund providers and advisors face. The products, nearly all of which are ETFs, carried an average expense ratio roughly 40 basis points higher than a similar screen of index funds with the largest inflows, Morningstar Direct data show. That cost, says Greg McBride, chief analyst at Bankrate, is partly what led to a combined $80 billion in outflows.
“Many, but not all, of the index funds with the largest outflows over the past three years tend to fall under one or more of the following: sector or country specific, currency hedged, poor category performance, or higher cost than larger competitor offerings,” McBride says.
With an average expense ratio of 43 basis points, these products are significantly pricier than their peers, yet three basis points cheaper than the 0.48% investors paid for fund investing on average last year, according to Morningstar’s most recent annual fee survey, which reviewed the asset-weighted average expense ratios of all U.S. open-end mutual funds and ETFs. Home to $814 billion in AUM, the industry’s largest index tracker, the Vanguard Total Stock Market Index Fund Admiral Shares (VTSAX), has an expense ratio of 0.04% and net three-year inflows of $19.4 billion, data show.
Despite their respective falls from grace, all of the index funds on this list posted gains over three years — even outpacing the performance of a similar screen of funds with the largest inflows. Carrying an average return of 10.34%, the products were bested by the S&P 500’s 13.87%, as measured by SPDR S&P 500 ETF (SPY), and the Dow’s 16.48%, as measured by the SPDR Dow Jones Industrial Average ETF (DIA), data show. Funds with the largest inflows, meanwhile, had an average return of 8.50%.
Ben Johnson, director of passive fund research at Morningstar, says the correlation between fees and performance is not “apples-to-apples when taking the funds’ underlying exposures into account,” adding, “every basis point an investor pays out in fees is a basis point worth of returns that they don’t retain and reinvest for themselves.”
When looking under the hood, Johnson says many of these products were originally launched to allow investors long access in Europe and Japan “without taking on foreign currency risk,” adding that advisors must do their due diligence when helping clients diversify their retirement savings.
“Many of these funds offer niche exposures and will at best play a bit part in most investors’ portfolios,” Johnson says. “The exceptions on the list are a number of zombie index mutual funds. These funds were brought to market to round out their sponsors’ offerings directed at 401(k) plans. As plan menus change and plan participants retire and begin to draw down their savings to spend against retirement, these funds have witnessed significant outflows.”
Scroll through to see the 20 index funds ranked by their estimated share class net outflows through the end of June. Funds with less than $500 million in AUM and investment minimums over $100,000 were excluded, as were ETNs, leveraged and institutional funds. Assets and expense ratios for each fund, as well as three-year daily returns through July 10, are also listed. The data is based on each fund's primary share class.


