Top-performing international stock funds of the decade

As with many fund sectors, long-term winners in international equity have started to shed some gains.

For nearly all of the 20 international stock funds with the best 10-year returns — and at least $100 million in assets under management — investors' recent shift from growth stocks to value has dealt a considerable blow. Nevertheless, the funds in this ranking have stayed on par with broader markets with an average 13.36% gain over the decade, Morningstar Direct data show.

With an average gain of just over 3% so far in 2021, however, the shift has brought what could have been a stellar decade of returns back down to earth, according to Mark Corcoran, OCIO at portfolio manager tru Independence.

“Recent underperformance is, in general, related to rotation away from growth toward value — that is, from companies which have traded at premium valuations because of their faster growth, to companies with deeply cyclical businesses (such as energy) or those which have been largely overlooked because of their slower-growing, more mature businesses and industries,” Corcoran says. “The other major reason is a shift in capital from primarily large cap, to include more mid and small cap companies.”

For comparison, index trackers such as the SPDR S&P 500 ETF Trust (SPY) and SPDR Dow Jones Industrial Average ETF (DIA) had 10-year returns of 14.32% and 13.12%, respectively. Over the past 12 months, they had gains of 50.13% and 50.59%. So far this year, the funds have gains of 11.69% and 13.02%.

Analysis of their fees show that despite mediocre returns, the funds in this ranking are also considerably costlier than the broader industry. With an average net expense ratio of more than 112 basis points, the international equity funds here are more than twice the 0.45% investors paid on average for fund investing in 2019, according to Morningstar’s most recent annual fee survey.

Although domestic equities have generally outperformed foreign, developed and emerging markets for several decades, “in terms of total return versus the amount of total return variability,” Corcoran reminds advisors and clients that past performance is not always an indicator of the future.

“The recent change in regional, size, style and sector favorites is another great reminder that diversification among various asset classes is a key to long-term success for most investors,” he says. “That also holds true for international holdings, which for many years may underperform the U.S., then have stellar periods of outperformance.”

Scroll through to see the 20 international equity sector funds with the best 10-year returns, and at least $100 million in AUM, through May 14. Net expense ratios, loads, investment minimums, and manager names, as well as YTD, one-, three-, five- and 15-year returns and month-end share class flows through May 1 are also listed. The data show each fund's primary share class. All data is from Morningstar Direct.

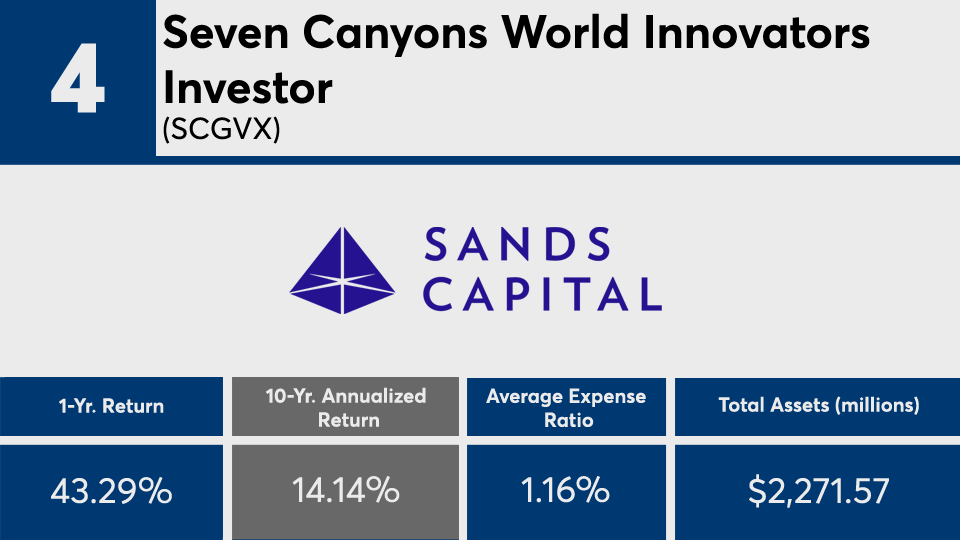
FP051821_20 copy.png
YTD Return: 7.83%; 3-Yr. Annualized Return: 18.18%; 5-Yr. Annualized Return: 18.03%; 15-Yr. Annualized Return: 8.95%; YTD Net Flow: (millions): ($8.58); 1-Yr. Net Flow (millions): ($75.68); 3-Yr. Net Flow (millions): ($139.67); 5-Yr. Net Flow (millions): ($224.8); 10-Yr. Net Flow (millions): ($306.97); 15-Yr. Net Flow (millions): ($394.64); Minimum Initial Investment: $2,500; Inception Date: Dec. 1, 1998; Manager Names: Keith Creveling, Brent Puff and Ted Harlan
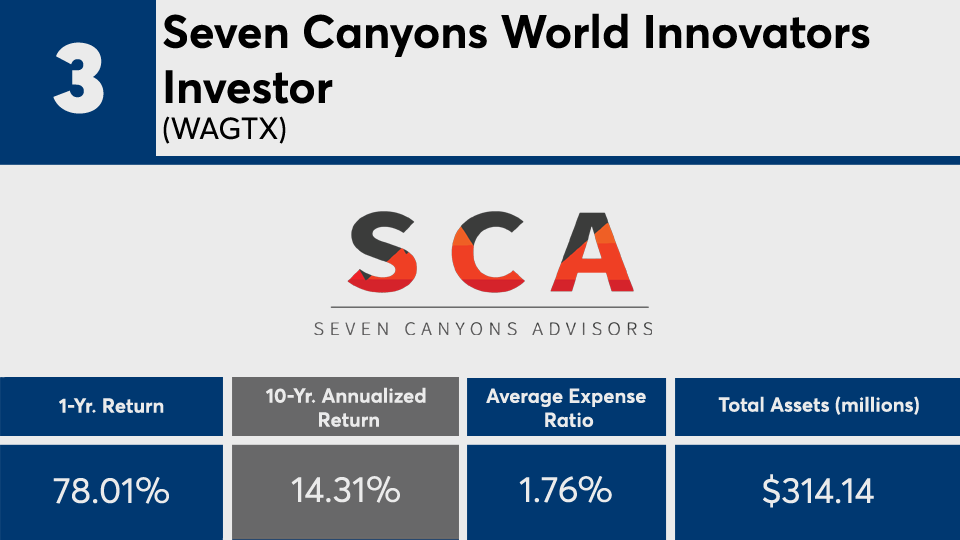
FP051821_19 copy.png
YTD Return: 6.1%; 3-Yr. Annualized Return: 17.06%; 5-Yr. Annualized Return: 17.77%; 15-Yr. Annualized Return: 9.35%; YTD Net Flow: (millions): ($72.06); 1-Yr. Net Flow (millions): ($70.62); 3-Yr. Net Flow (millions): ($272.87); 5-Yr. Net Flow (millions): ($404.5); 10-Yr. Net Flow (millions): ($588.64); 15-Yr. Net Flow (millions): ($863.03); Inception Date: May 30, 1990; Manager Names: Stephen DuFour, William J. Kennedy and Andrew Sergeant
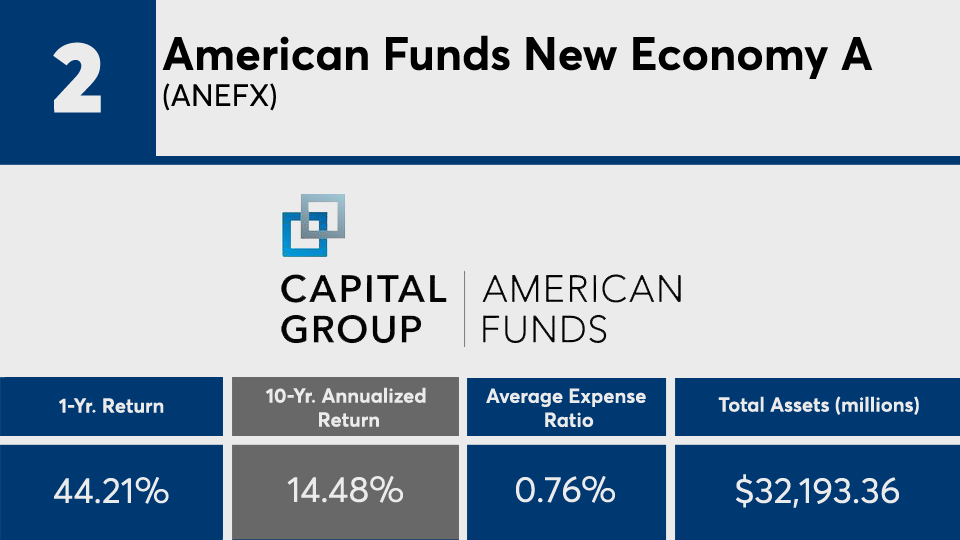
FP051821_18 copy.png
YTD Return: 1.18%; 3-Yr. Annualized Return: 17.28%; 5-Yr. Annualized Return: 19%; YTD Net Flow: (millions): ($9.91); 1-Yr. Net Flow (millions): ($44.48); 3-Yr. Net Flow (millions): ($130.6); 5-Yr. Net Flow (millions): ($233.93); 10-Yr. Net Flow (millions): ($151.17); Minimum Initial Investment: $500; Inception Date: June 16, 2009; Manager Names: William S. Barker, Anthony L. Arsta, Nathan G. Weisshaar, Bryan C. Hinmon and Michael J. Olsen
FP051821_17 copy.png
YTD Return: -2.21%; 3-Yr. Annualized Return: 18.94%; 5-Yr. Annualized Return: 19.49%; YTD Net Flow: (millions): $51.48; 1-Yr. Net Flow (millions): $160.76; 3-Yr. Net Flow (millions): $35.17; 5-Yr. Net Flow (millions): $135.69; 10-Yr. Net Flow (millions): $241.95; Minimum Initial Investment: $1,000; Inception Date: Oct. 1, 2007; Manager Name: Randall Dishmon
FP051821_16 copy.png
YTD Return: 7.59%; 3-Yr. Annualized Return: 15.71%; 5-Yr. Annualized Return: 15.26%; 15-Yr. Annualized Return: 8.05%; YTD Net Flow: (millions): ($15.7); 1-Yr. Net Flow (millions): ($48.22); 3-Yr. Net Flow (millions): ($155.12); 5-Yr. Net Flow (millions): ($262.83); 10-Yr. Net Flow (millions): ($504.3); 15-Yr. Net Flow (millions): ($1,014.80); Minimum Initial Investment: $1,000; Inception Date: Oct. 19, 1955; Manager Names: Timothy Creedon and Hariharan Ramanan
FP051821_15 copy.png
YTD Return: -0.34%; 3-Yr. Annualized Return: 16.67%; 5-Yr. Annualized Return: 18.12%; 15-Yr. Annualized Return: 9.15%; YTD Net Flow: (millions): ($7.71); 1-Yr. Net Flow (millions): ($8.08); 3-Yr. Net Flow (millions): ($17); 5-Yr. Net Flow (millions): ($32); 10-Yr. Net Flow (millions): ($51.58); 15-Yr. Net Flow (millions): ($104.44); Minimum Initial Investment: $1,000; Redemption Load: 2%; Inception Date: Feb. 7, 1994; Manager Names: Caesar M.P. Bryan, Howard F. Ward and Christopher D. Ward
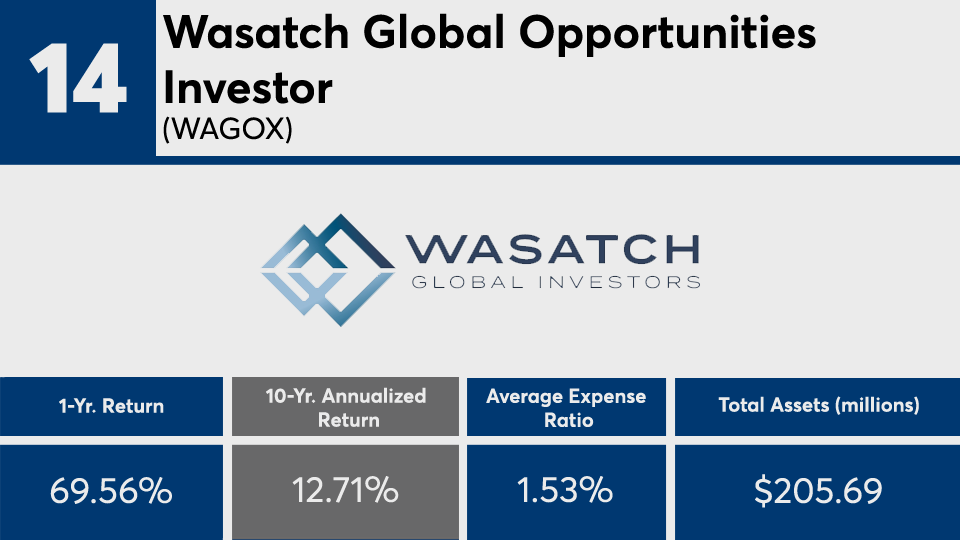
FP051821_14 copy.png
YTD Return: 3.89%; 3-Yr. Annualized Return: 19.98%; 5-Yr. Annualized Return: 20.63%; YTD Net Flow: (millions): $8.21; 1-Yr. Net Flow (millions): $0.69; 3-Yr. Net Flow (millions): ($11.94); 5-Yr. Net Flow (millions): ($99.3); 10-Yr. Net Flow (millions): ($312.31); Minimum Initial Investment: $2,000; Redemption Load: 2%; Inception Date: Nov. 17, 2008; Manager Names: Ajay Krishnan, Kenneth P. Applegate, J.B. Taylor and Paul Lambert
FP051821_13 copy.png
YTD Return: 5.51%; 3-Yr. Annualized Return: 17.7%; 5-Yr. Annualized Return: 18.53%; 15-Yr. Annualized Return: 10.05%; YTD Net Flow: (millions): ($79.92); 1-Yr. Net Flow (millions): ($1,058.17); 3-Yr. Net Flow (millions): ($5,128.81); 5-Yr. Net Flow (millions): ($11,303.78); 10-Yr. Net Flow (millions): ($20,840.51); 15-Yr. Net Flow (millions): ($33,847.88); Minimum Initial Investment: $250; Front Load: 5.75%; Inception Date: March 13, 1973; Manager Names: Robert W. Lovelace, Steven T. Watson, Jonathan Knowles, Andraz Razen, Jody F. Jonsson, Brady L. Enright and Noriko H. Chen
FP051821_12 copy.png
YTD Return: 2.32%; 3-Yr. Annualized Return: 15.93%; 5-Yr. Annualized Return: 17.39%; YTD Net Flow: (millions): $4.07; 1-Yr. Net Flow (millions): ($14.67); 3-Yr. Net Flow (millions): ($49.38); 5-Yr. Net Flow (millions): ($119.46); 10-Yr. Net Flow (millions): N/A; Minimum Initial Investment: $1,000; Inception Date: March 29, 1010; Manager Names: Mark L. Yockey, Andrew J. Euretig and Charles-Henri Hamker
FP051821_11 copy.png
YTD Return: 1.29%; 3-Yr. Annualized Return: 10.52%; 5-Yr. Annualized Return: 14.89%; 15-Yr. Annualized Return: 10.29%; YTD Net Flow: (millions): ($50.17); 1-Yr. Net Flow (millions): ($246.11); 3-Yr. Net Flow (millions): ($1,900.09); 5-Yr. Net Flow (millions): ($453.54); 10-Yr. Net Flow (millions): $911.95; 15-Yr. Net Flow (millions): $1,395.07; Inception Date: Sept. 7, 2005; Manager Name: David A. Nadel
FP051821_10 copy.png
YTD Return: 5.25%; 3-Yr. Annualized Return: 20.2%; 5-Yr. Annualized Return: 20.79%; YTD Net Flow: (millions): $32.01; 1-Yr. Net Flow (millions): $252.45; 3-Yr. Net Flow (millions): $309.85; 5-Yr. Net Flow (millions): $353.18; 10-Yr. Net Flow (millions): $388.32; Minimum Initial Investment: $2,500; Inception Date: Oct. 27, 2008; Manager Name: R. Scott Berg
FP051821_9 copy.png
YTD Return: -1.55%; 3-Yr. Annualized Return: 10.21%; 5-Yr. Annualized Return: 20.18%; 15-Yr. Annualized Return: 10.28%; YTD Net Flow: (millions): ($59.35); 1-Yr. Net Flow (millions): ($220.63); 3-Yr. Net Flow (millions): ($1,063.03); 5-Yr. Net Flow (millions): ($844.93); 10-Yr. Net Flow (millions): ($1,447.93); 15-Yr. Net Flow (millions): ($2,407.90); Minimum Initial Investment: $1,000; Front Load: 5.5% Inception Date: Oct. 22, 1990; Manager Names: Frank V. Jennings and Maire Lane
FP051821_8 copy.png
YTD Return: 2.74% 3-Yr. Annualized Return: 16.7% 5-Yr. Annualized Return: 19.66% YTD Net Flow: (millions): ($5.71) 1-Yr. Net Flow (millions): ($18.13) 3-Yr. Net Flow (millions): ($85.2) 5-Yr. Net Flow (millions): ($105.21) 10-Yr. Net Flow (millions): ($196.09) Minimum Initial Investment: $2,500 Inception Date: June 29, 2007 Manager Names: Thomas F. Marsico, Brandon A. Geisler and Robert G. Susman
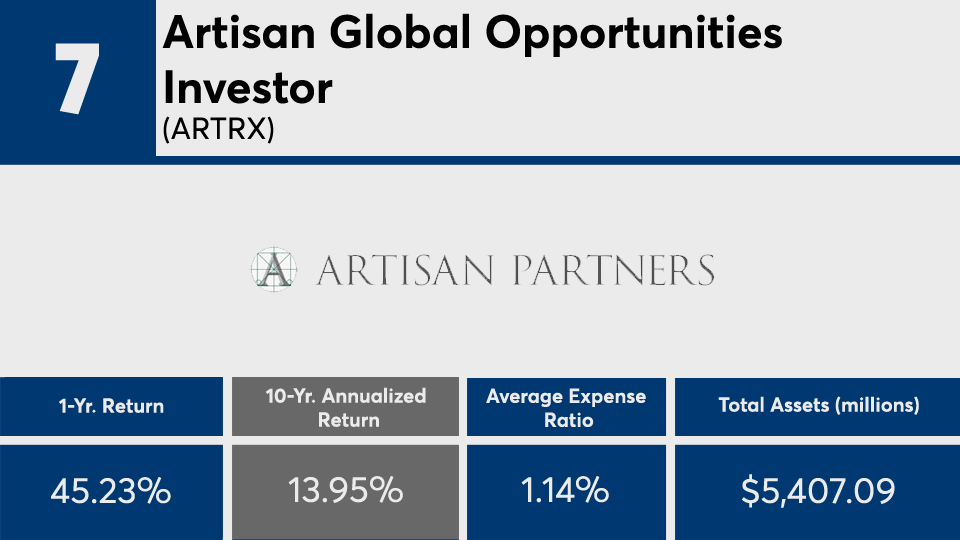
FP051821_7 copy.png
YTD Return: 1.58%; 3-Yr. Annualized Return: 17.8%; 5-Yr. Annualized Return: 19.33%; YTD Net Flow: (millions): ($67.42); 1-Yr. Net Flow (millions): ($42.45); 3-Yr. Net Flow (millions): ($244.2); 5-Yr. Net Flow (millions): ($153.41); 10-Yr. Net Flow (millions): $198.85; Minimum Initial Investment: $1,000; Inception Date: Sept. 22, 2008; Manager Names: Craigh A. Cepukenas, James D. Hamel, Matthew H. Kamm and Jason L. White
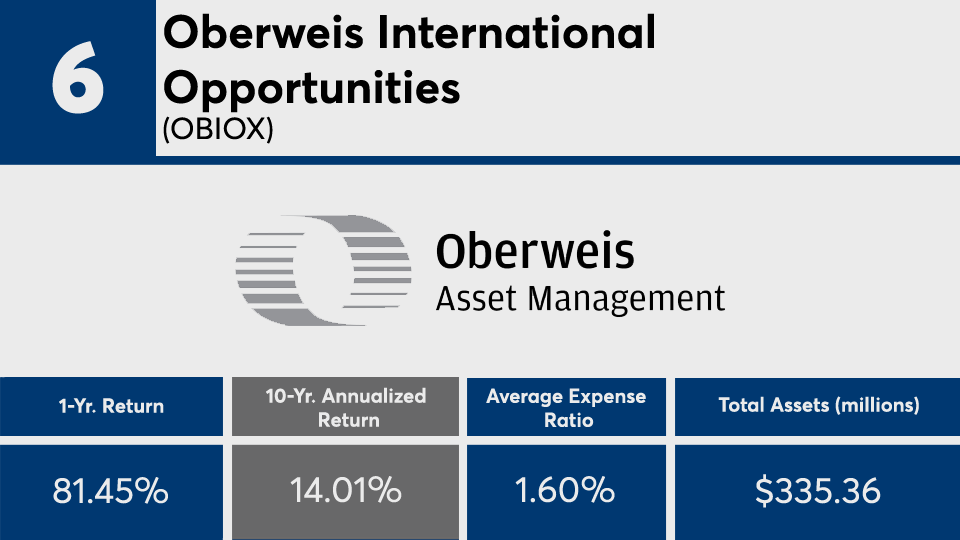
FP051821_6 copy.png
YTD Return: 0.92%; 3-Yr. Annualized Return: 14.2%; 5-Yr. Annualized Return: 15.71%; YTD Net Flow: (millions): ($2.17); 1-Yr. Net Flow (millions): ($53.98); 3-Yr. Net Flow (millions): ($572.88); 5-Yr. Net Flow (millions): ($733.61); 10-Yr. Net Flow (millions): ($1.31); Minimum Initial Investment: $1,000; Redemption Load: 2%; Inception Date: Feb. 1, 2007; Manager Names: Lance F. James, Thomas L. Press, Robert E. Scott, George Prince, Peter M. Capouch, Kaj Doerring, Monika LaRiche, Andrei Bolshakov and Thomas Dignard
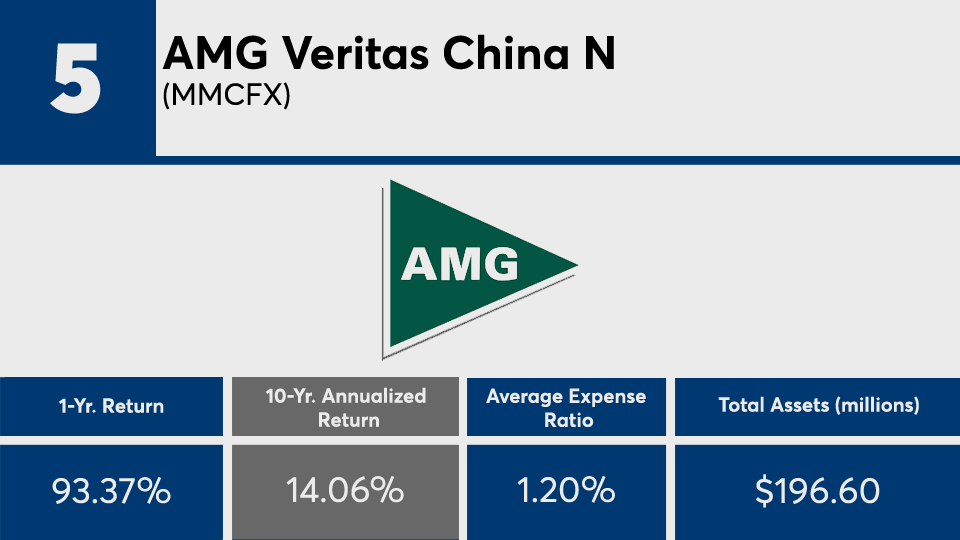
FP051821_5 copy.png
YTD Return: 20.11%; 3-Yr. Annualized Return: 16.73%; 5-Yr. Annualized Return: 21.55%; 15-Yr. Annualized Return: 10.61%; YTD Net Flow: (millions): ($10.73); 1-Yr. Net Flow (millions): ($22.93); 3-Yr. Net Flow (millions): ($56.44); 5-Yr. Net Flow (millions): ($89.47); 10-Yr. Net Flow (millions): ($157.02); 15-Yr. Net Flow (millions): ($432.5); Minimum Initial Investment: $2,000; Inception Date: June 30, 1994; Manager Names: Lance F. James, Thomas L. Press, Robert E. Scott, George Prince, Peter M. Capouch, Kaj Doerring, Monika LaRiche, Andrei Bolshakov and Thomas Dignard
FP051821_4 copy.png
YTD Return: -2.29%; 3-Yr. Annualized Return: 18.74%; 5-Yr. Annualized Return: 21.79%; YTD Net Flow: (millions): ($0.84); 1-Yr. Net Flow (millions): ($3.05); 3-Yr. Net Flow (millions): $4.66; 5-Yr. Net Flow (millions): $6.22; 10-Yr. Net Flow (millions): $11.4; Minimum Initial Investment: $100,000; Redemption Load: 2%; Inception Date: March 31, 2010; Manager Names: David E. Levanson, T. Perry Williams and Brian A. Christiansen
FP051821_3 copy.png
YTD Return: 1.82%; 3-Yr. Annualized Return: 21.98%; 5-Yr. Annualized Return: 21.1%; 15-Yr. Annualized Return: 11.15%; YTD Net Flow: (millions): $18.15; 1-Yr. Net Flow (millions): $41.23; 3-Yr. Net Flow (millions): ($64.06); 5-Yr. Net Flow (millions): ($102.7); 10-Yr. Net Flow (millions): ($73.69); 15-Yr. Net Flow (millions): ($119.93); Minimum Initial Investment: $2,000; Redemption Load: 2%; Inception Date: Dec. 19, 2000; Manager Names: Samuel S. Stewart, Joshua Stewart and Spencer P. Stewart
FP051821_2 copy.png
YTD Return: 1.73%; 3-Yr. Annualized Return: 14.36%; 5-Yr. Annualized Return: 19.29%; 15-Yr. Annualized Return: 11.03%; YTD Net Flow: (millions): ($18.52); 1-Yr. Net Flow (millions): ($207.14); 3-Yr. Net Flow (millions): ($1,381.54); 5-Yr. Net Flow (millions): ($3,011.89); 10-Yr. Net Flow (millions): ($3,020.73); 15-Yr. Net Flow (millions): ($5,217.25); Minimum Initial Investment: $250; Front Load: 5.75%; Inception Date: Dec. 1, 1983; Manager Names: Timothy D. Armour, Harold H. La, Caroline Jones, Mathews Cherian, Richmond Wolf, Tomoko Fortune and Reed Lowenstein
FP051821_1 copy.png
YTD Return: 5%; 3-Yr. Annualized Return: 23.95%; 5-Yr. Annualized Return: 24.46%; 15-Yr. Annualized Return: 10.59%; YTD Net Flow: (millions): $477.97; 1-Yr. Net Flow (millions): $1,346.19; 3-Yr. Net Flow (millions): $2,114.33; 5-Yr. Net Flow (millions): $2,187.54; 10-Yr. Net Flow (millions): $1,757.11; 15-Yr. Net Flow (millions): $2,395.63; Minimum Initial Investment: $2,500; Inception Date: Dec. 29, 1995; Manager Name: David J. Eiswert
MORE FROM FINANCIAL PLANNING