Large-cap funds with the best 10-year returns

Large-cap funds with the biggest gains of the decade have racked up even bigger returns in a year marked by coronavirus-driven market volatility. One caveat for advisors and clients looking to ride the wave: Their outsized gains come with hefty price tags.

The 20 large-cap mutual funds and ETFs with the best 10-year returns generated an average gain of 18.68%, Morningstar Direct data show. So far this year, the same funds notched an average return of more than 42%.

Compared with the broader industry, index trackers such as the SPDR S&P 500 ETF Trust (SPY) and the SPDR Dow Jones Industrial Average ETF Trust (DIA) delivered 10-year returns of 12.90% and 11.66%, respectively, over the same period. Year-to-date, SPY reported a gain of 2.82%, while DIA had a loss of 5.36%.

In bonds, the iShares Core U.S. Aggregate Bond ETF (AGG) had gains of 6.57% and 3.53% over the YTD and 10-year periods.

Stephen Colavito, chief market strategist at Lakeview Capital Partners, says many of the funds have benefited from a run-up in certain stock holdings during the coronavirus lockdown.

“All of these funds have one thing in common; their top holdings are focused on those companies that have benefited in a post-COVID world,” Colavito says. “Companies like Amazon, Nvidia, Shopify, PayPal and Apple have appreciated nicely so far in 2020.”

Their gains, however, came at a price. With an average fee of 81 basis points, these funds were well above the 0.45% investors paid for fund investing last year, according to Morningstar’s most recent annual fee survey.

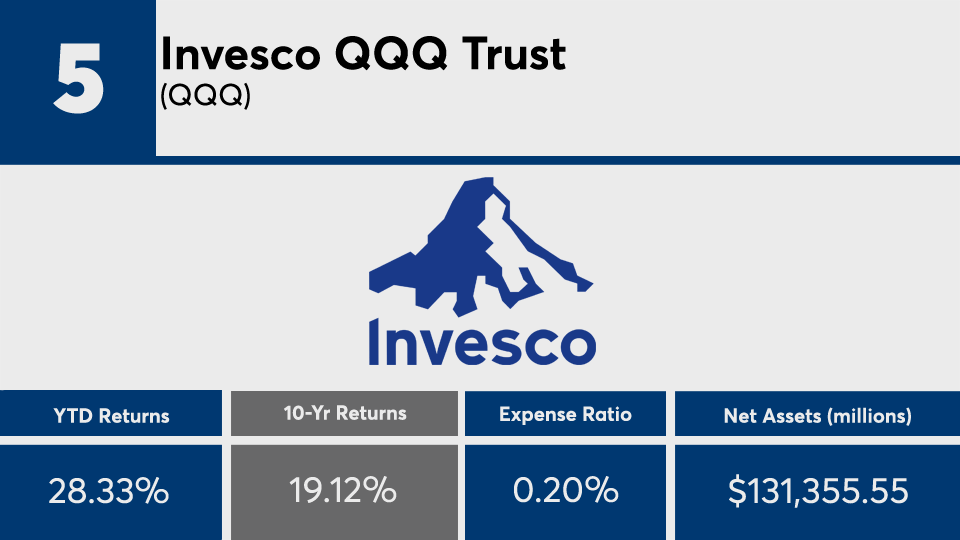
“Advisors would be wise to look at the top holdings of the funds they recommend to clients,” Colavito says. “For example, if a client is buying a mutual fund that mirrors the Nasdaq Index with a fee of 50 basis points, it may make better sense to buy the QQQ ETF with a management fee of 20 basis points. Unless a fund has a particular niche, it is hard to justify the extra expense.”

Scroll through to see the 20 large-cap mutual funds and ETFs with the best 10-year returns through Oct. 29. Funds with less than $100 million in AUM were excluded, as were funds with investment minimums above $100,000, leveraged and institutional funds. Assets and expense ratios, as well as YTD, one-, three- and five- returns are also listed for each. The data show each fund's primary share class. All data is from Morningstar Direct.

FP110420_20 copy.png

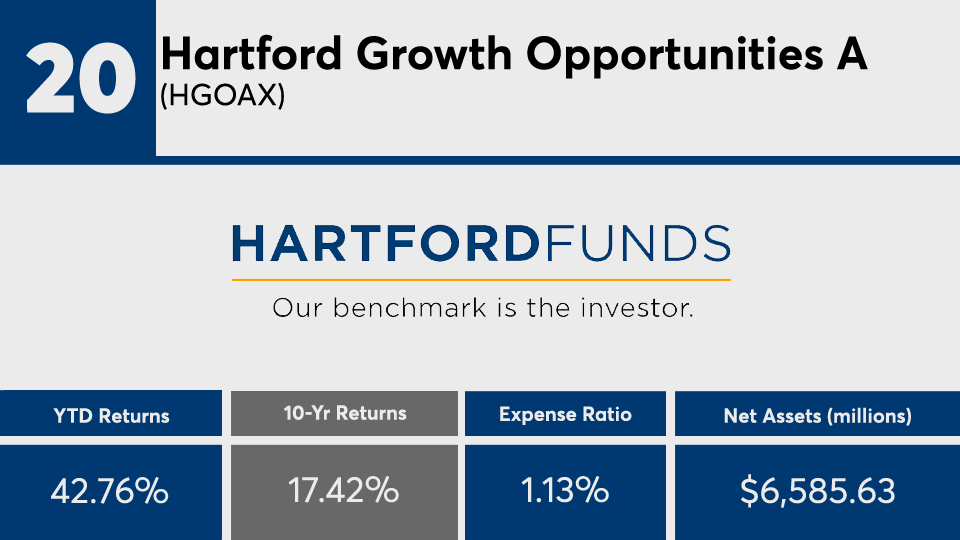
Hartford Growth Opportunities A (HGOAX)

1-Yr. Return: 51.94%
3-Yr. Annualized Return: 23.65%
5-Yr. Annualized Return: 19.1%
Front Load: 5.50%
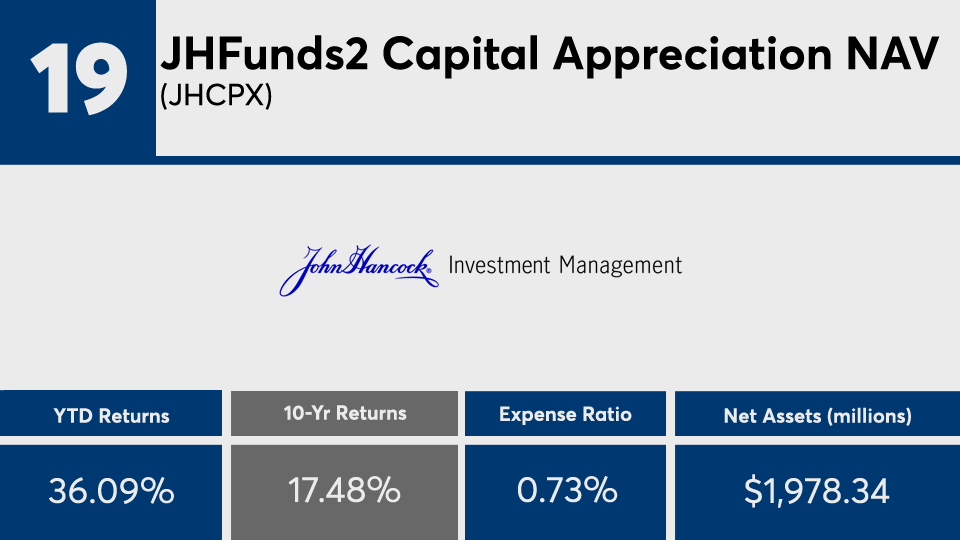
FP110420_19 copy.png

JHFunds2 Capital Appreciation NAV (JHCPX)

1-Yr. Return: 47.76%
3-Yr. Annualized Return: 22.86%
5-Yr. Annualized Return: 19.12%
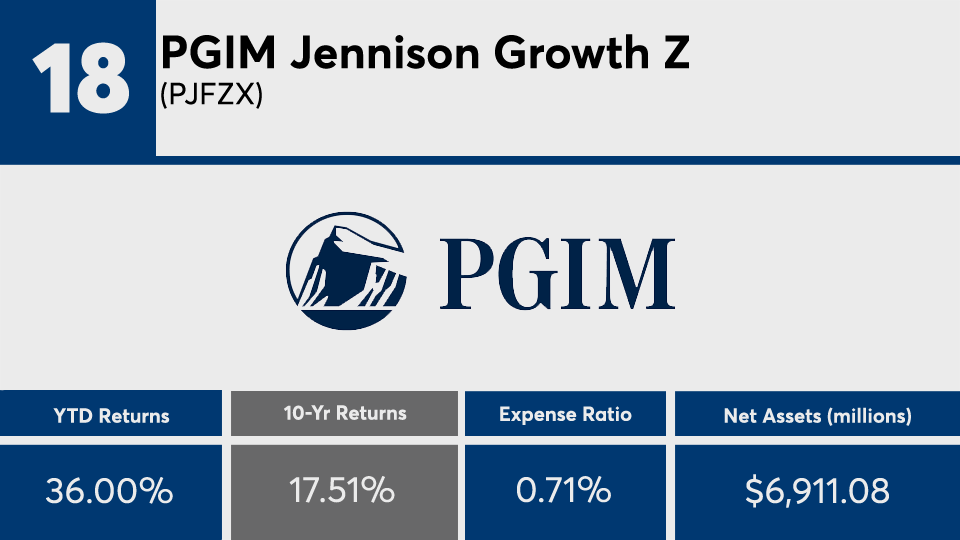
FP110420_18 copy.png

PGIM Jennison Growth Z (PJFZX)

1-Yr. Return: 47.71%
3-Yr. Annualized Return: 22.92%
5-Yr. Annualized Return: 19.19%
FP110420_17 copy.png

Baron Opportunity Retail (BIOPX)

1-Yr. Return: 71.16%
3-Yr. Annualized Return: 34.91%
5-Yr. Annualized Return: 25.82%
FP110420_16 copy.png

Vanguard US Growth Admiral (VWUAX)

1-Yr. Return: 46.4%
3-Yr. Annualized Return: 23.83%
5-Yr. Annualized Return: 19.08%
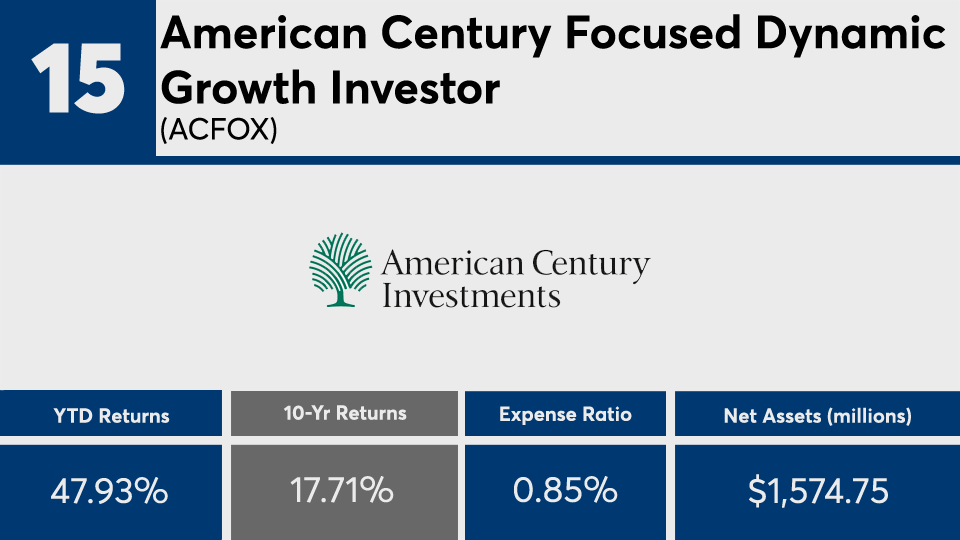
FP110420_15 copy.png

American Century Focused Dynamic Growth Investor (ACFOX)

1-Yr. Return: 59.55%
3-Yr. Annualized Return: 28.82%
5-Yr. Annualized Return: 23.37%
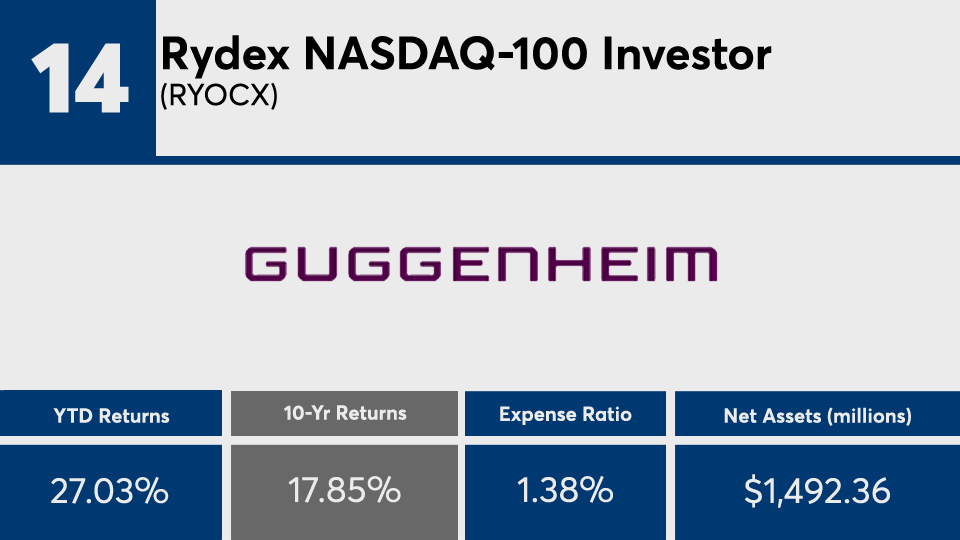
FP110420_14 copy.png

Rydex NASDAQ-100 Investor (RYOCX)

1-Yr. Return: 36.73%
3-Yr. Annualized Return: 21.05%
5-Yr. Annualized Return: 18.65%
FP110420_13 copy.png

Touchstone Sands Capital Select Growth Y (CFSIX)

1-Yr. Return: 56.93%
3-Yr. Annualized Return: 26.77%
5-Yr. Annualized Return: 19.69%
FP110420_12 copy.png

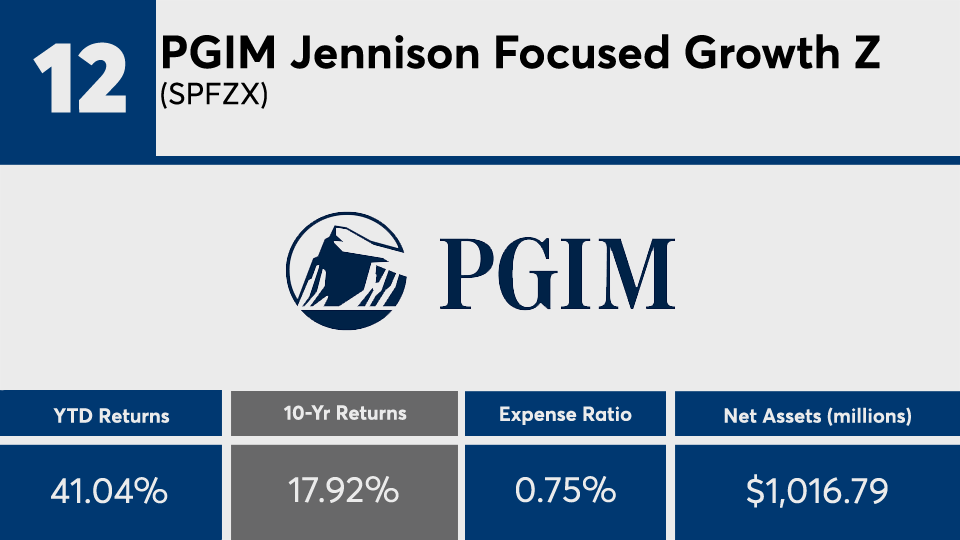
PGIM Jennison Focused Growth Z (SPFZX)

1-Yr. Return: 53.67%
3-Yr. Annualized Return: 25.44%
5-Yr. Annualized Return: 20.32%
FP110420_11 copy.png

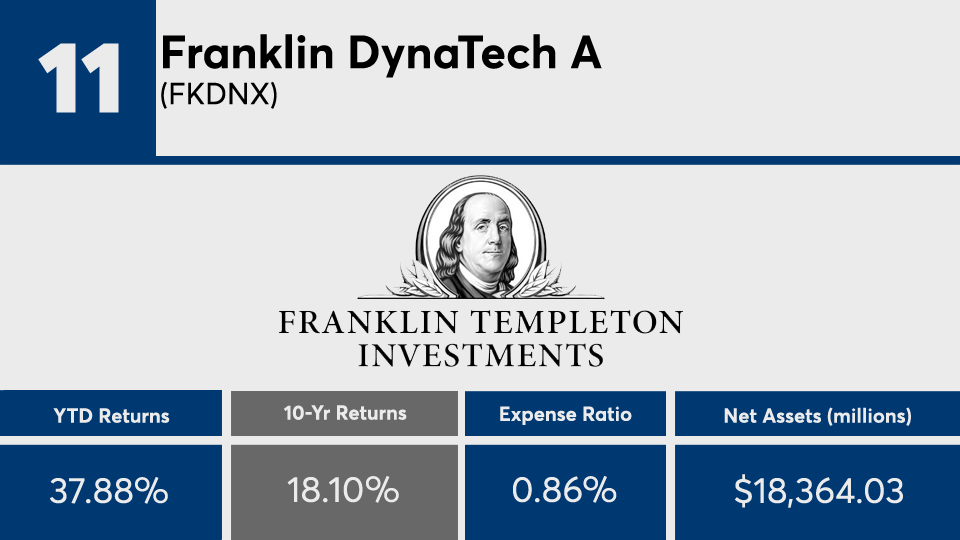
Franklin DynaTech A (FKDNX)

1-Yr. Return: 46.51%
3-Yr. Annualized Return: 25.24%
5-Yr. Annualized Return: 22.19%
Front Load: 5.50%
FP110420_10 copy.png

Fidelity Blue Chip Growth (FBGRX)

1-Yr. Return: 49.36%
3-Yr. Annualized Return: 24.32%
5-Yr. Annualized Return: 20.52%
FP110420_09 copy.png

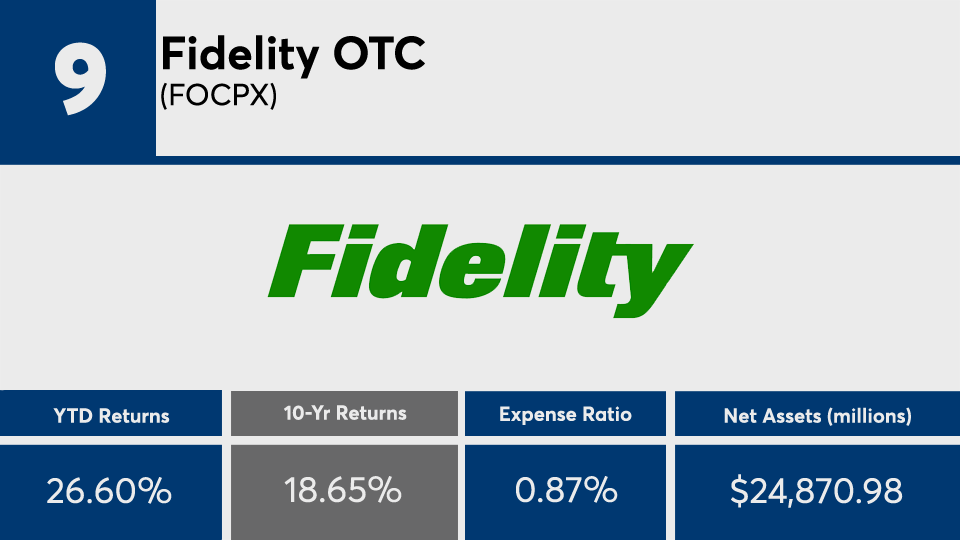
Fidelity OTC (FOCPX)

1-Yr. Return: 37.61%
3-Yr. Annualized Return: 20.63%
5-Yr. Annualized Return: 20.16%
FP110420_08 copy.png

USAA NASDAQ-100 Index (USNQX)

1-Yr. Return: 38.12%
3-Yr. Annualized Return: 22.21%
5-Yr. Annualized Return: 19.7%
FP110420_07 copy.png

VALIC Company I NASDAQ-100 Index (VCNIX)

1-Yr. Return: 37.9%
3-Yr. Annualized Return: 22%
5-Yr. Annualized Return: 19.6%
FP110420_06 copy.png

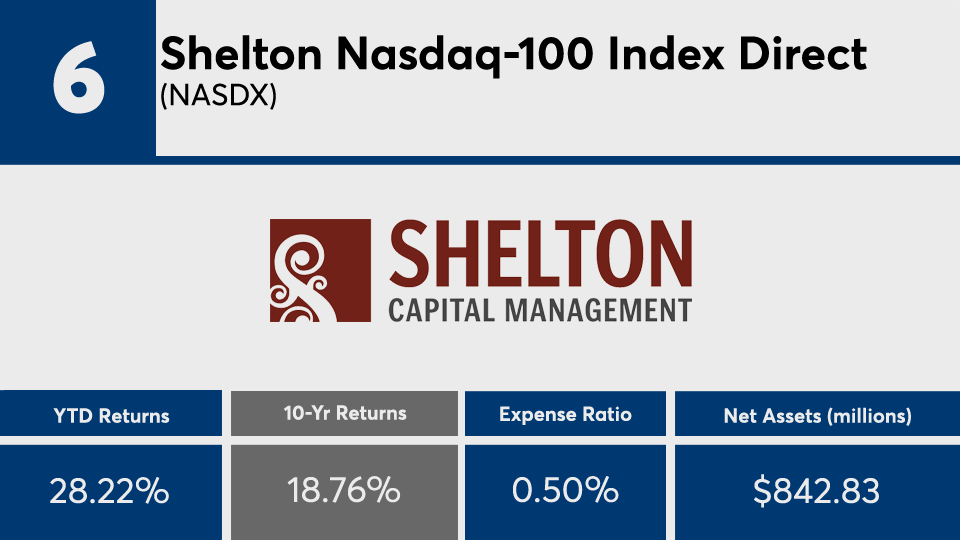
Shelton Nasdaq-100 Index Direct (NASDX)

1-Yr. Return: 38.48%
3-Yr. Annualized Return: 21.8%
5-Yr. Annualized Return: 19.24%
FP110420_05 copy.png

Invesco QQQ Trust (QQQ)

1-Yr. Return: 38.42%
3-Yr. Annualized Return: 22.51%
5-Yr. Annualized Return: 20.03%
FP110420_04 copy.png

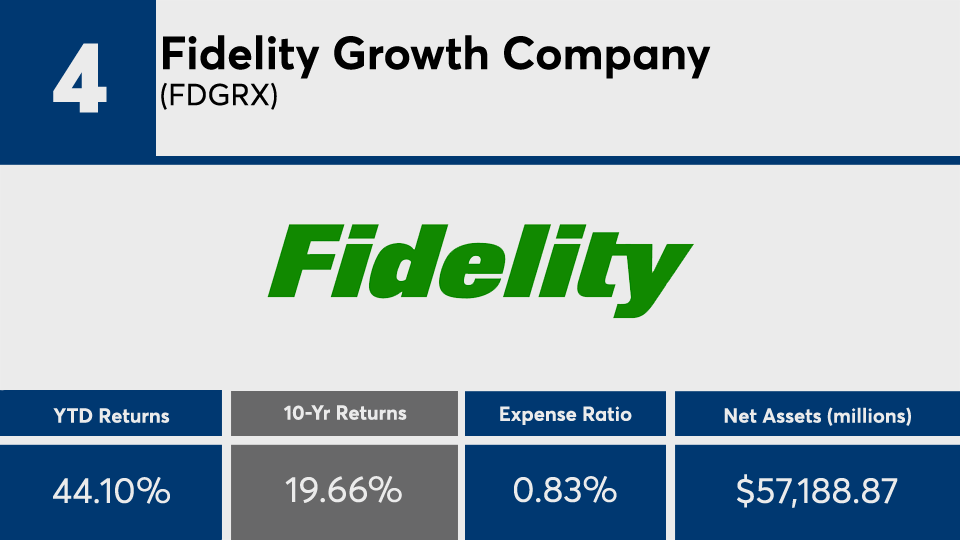
Fidelity Growth Company (FDGRX)

1-Yr. Return: 57.49%
3-Yr. Annualized Return: 25.26%
5-Yr. Annualized Return: 22.56%
FP110420_03 copy.png

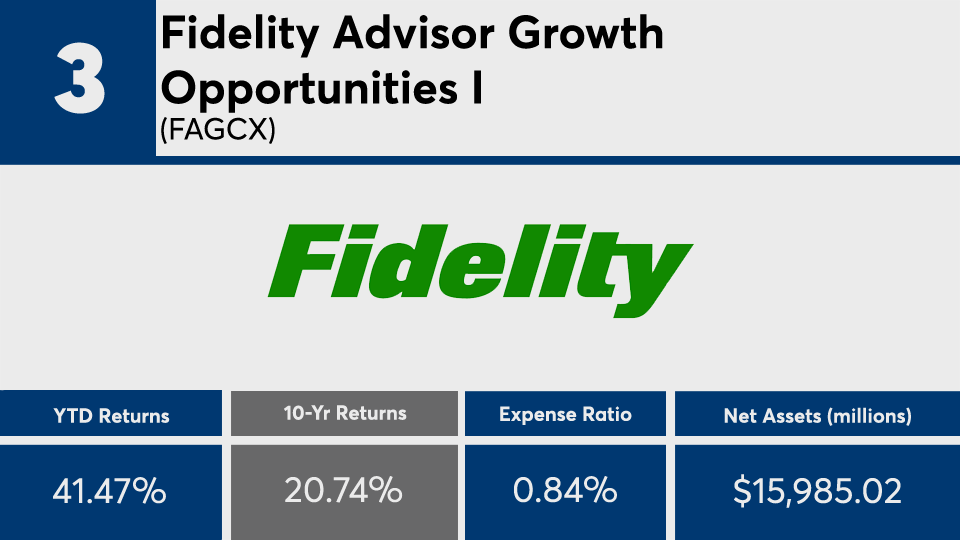
Fidelity Advisor Growth Opportunities I (FAGCX)

1-Yr. Return: 53.4%
3-Yr. Annualized Return: 33.19%
5-Yr. Annualized Return: 25.18%
FP110420_02 copy.png

Virtus Zevenbergen Innovative Growth Stock I (SCATX)

1-Yr. Return: 103%
3-Yr. Annualized Return: 42.55%
5-Yr. Annualized Return: 30.07%
FP110420_01 copy.png

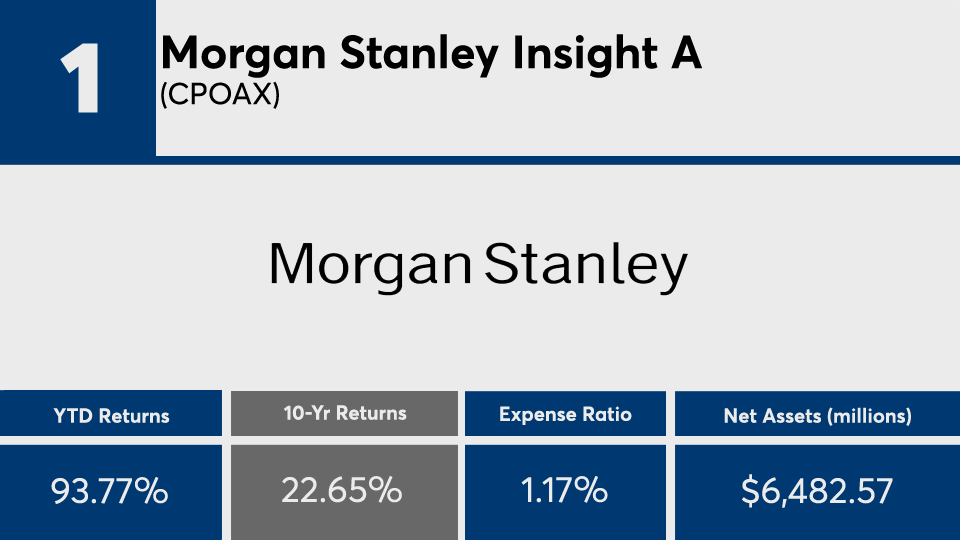
Morgan Stanley Insight A (CPOAX)

1-Yr. Return: 107.93%
3-Yr. Annualized Return: 44.39%
5-Yr. Annualized Return: 32.97%
Front Load: 5.25%
MORE FROM FINANCIAL PLANNING