20 lowest-cost funds with the worst 10-year returns

The pursuit for rock-bottom fees doesn’t always pay off.

Analysis of mutual funds and ETFs with some of the lowest net expense ratios in the industry show even the cheapest funds can underperform. The 20 worst-performers with expense ratios under 5 basis points — and with at least $500 million in assets under management — notched an average 10-year return of just 2.77%, data from Morningstar Direct show.

That comes in well below the gains made by major benchmarks over the same period. In comparison, the S&P 500 had a 10-year return of 11.42%, as measured by the SPDR S&P 500 ETF Trust (SPY). The Dow edged a gain of 10.75%, as measured by the SPDR Dow Jones Industrial Average ETF Tracker (DIA). And, on the bonds side, the Bloomberg Barclays US Aggregate Bond Index saw a gain of 3.86%, as measured by the iShares Core US Aggregate Bond ETF (AGG).

“Very low-cost funds and index funds are maybe the best things that have happened to investing in the last decade,” says Phil Toews, CEO of the Toews Corporation, an asset management firm that specializes in fixed-income investment products.

“But at the same time, some of these very low-cost index funds may be overpriced, in the sense that all you’re doing is mirroring a passive index,” he says.

Despite their underperformance, these funds carried an average net expense ratio of just 3 basis points — placing them well below the broader industry’s average of 0.48%, according to Morningstar’s most recent annual fee survey, which reviewed the asset-weighted average expense ratios of all U.S. open-end mutual funds and ETFs.

Fees here were more closely aligned with some of the industry’s biggest hitters. The largest overall fund, SPY, has $252.9 billion in AUM and carried a 0.09% expense ratio, data show. On the bonds side, the $174.7 billion Vanguard Total Bond Market Index Fund (VBTLX), had a 0.05% expense ratio and notched a 10-year gain of 3.95%.

When preparing clients for the long term, Toews suggests advisors help them look beyond the fees and “frequently discuss the possibility of extreme negative markets,” adding that these conversations can help “explain what their plan is for when markets falter. If you do that, you remove the uncertainty and some of the fear associated with a decline.”

Scroll through to see the 20 funds with fees below 5 basis points and the lowest 10-year returns through April 28. Funds with less than $500 million in AUM and investment minimums over $100,000 were excluded, as were leveraged and institutional funds. Assets and expense ratios, as well as year-to-date and one-, three-, five- and 10-year returns are listed for each. The data show each fund's primary share class. All data is from Morningstar Direct.

FP050320_20.png

Loomis Sayles Securitized Asset (LSSAX)

1-Yr. Return: 4.23%
3-Yr. Annualized Return: 3.70%
5-Yr. Annualized Return: 3.21%
FP050320_19.png

Western Asset SMASh Series C (LMLCX)

1-Yr. Return: -3.99%
3-Yr. Annualized Return: 1.29%
5-Yr. Annualized Return: 2.37%
FP050320_18.png

Fidelity Series Investment Grade Bond (FSIGX)

1-Yr. Return: 9.01%
3-Yr. Annualized Return: 4.95%
5-Yr. Annualized Return: 3.87%
FP050320_17.png

American Century NT Diversified Bond G (ACLDX)

1-Yr. Return: 10.33%
3-Yr. Annualized Return: 4.87%
5-Yr. Annualized Return: 3.54%
FP050320_16.png

Vanguard Total Bond Market Index Admiral (VBTLX)

1-Yr. Return: 10.95%
3-Yr. Annualized Return: 5.17%
5-Yr. Annualized Return: 3.71%
FP050320_15 copy.png

iShares US Aggregate Bond Index K (WFBIX)

1-Yr. Return: 11.00%
3-Yr. Annualized Return: 5.16%
5-Yr. Annualized Return: 3.66%
FP050320_14.png

iShares Core US Aggregate Bond ETF (AGG)

1-Yr. Return: 10.44%
3-Yr. Annualized Return: 5.05%
5-Yr. Annualized Return: 3.55%
FP050320_13.png

SPDR Portfolio Aggregate Bond ETF (SPAB)

1-Yr. Return: 10.30%
3-Yr. Annualized Return: 4.99%
5-Yr. Annualized Return: 3.52%
FP050320_12.png

Vanguard Intermediate-Term Treasury ETF (VGIT)

1-Yr. Return: 11.88%
3-Yr. Annualized Return: 4.94%
5-Yr. Annualized Return: 3.36%
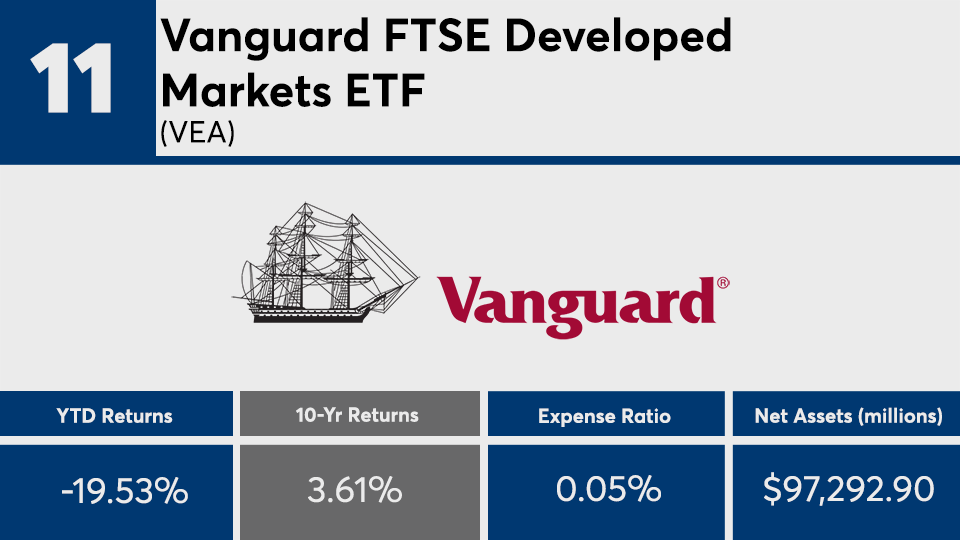
FP050320_11.png

Vanguard FTSE Developed Markets ETF (VEA)

1-Yr. Return: -12.95%
3-Yr. Annualized Return: -1.29%
5-Yr. Annualized Return: -0.55%
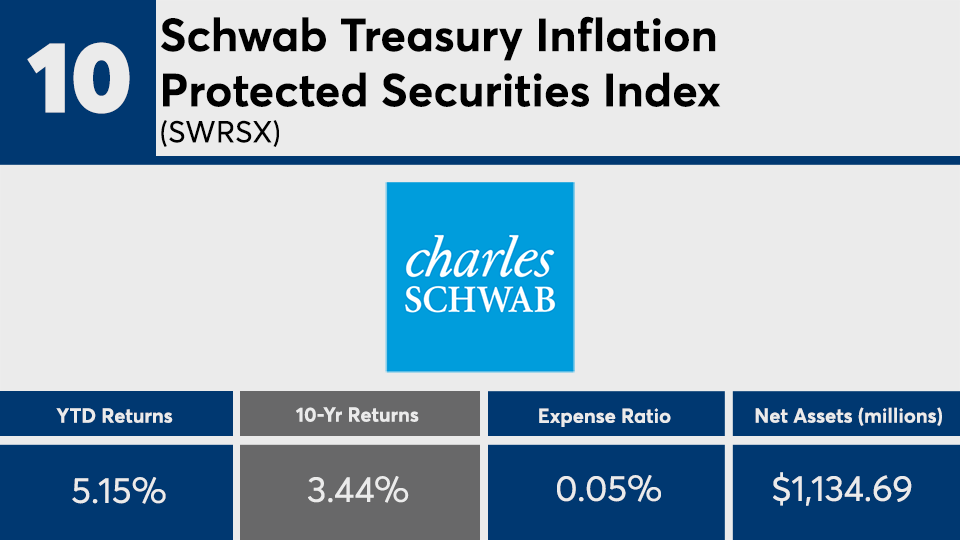
FP050320_10.png

Schwab Treasury Inflation Protected Securities Index (SWRSX)

1-Yr. Return: 10.03%
3-Yr. Annualized Return: 4.99%
5-Yr. Annualized Return: 3.52%
FP050320_9.png

SPDR Portfolio Developed World ex-US ETF (SPDW)

1-Yr. Return: -12.76%
3-Yr. Annualized Return: -1.23%
5-Yr. Annualized Return: -0.66%
FP050320_8.png

Vanguard Mortgage-Backed Secs ETF (VMBS)

1-Yr. Return: 7.13%
3-Yr. Annualized Return: 3.77%
5-Yr. Annualized Return: 2.78%
FP050320_7.png

Fidelity Series Emerging Markets Opportuninites (FEMSX)

1-Yr. Return: -9.08%
3-Yr. Annualized Return: 2.01%
5-Yr. Annualized Return: 1.72%
FP050320_6.png

Vanguard Short-Term Corporate Bond ETF (VCSH)

1-Yr. Return: 4.04%
3-Yr. Annualized Return: 2.95%
5-Yr. Annualized Return: 2.51%
FP050320_5.png

Fidelity Series Global ex US Index (FSGEX)

1-Yr. Return: -12.47%
3-Yr. Annualized Return: -0.67%
5-Yr. Annualized Return: -0.69%
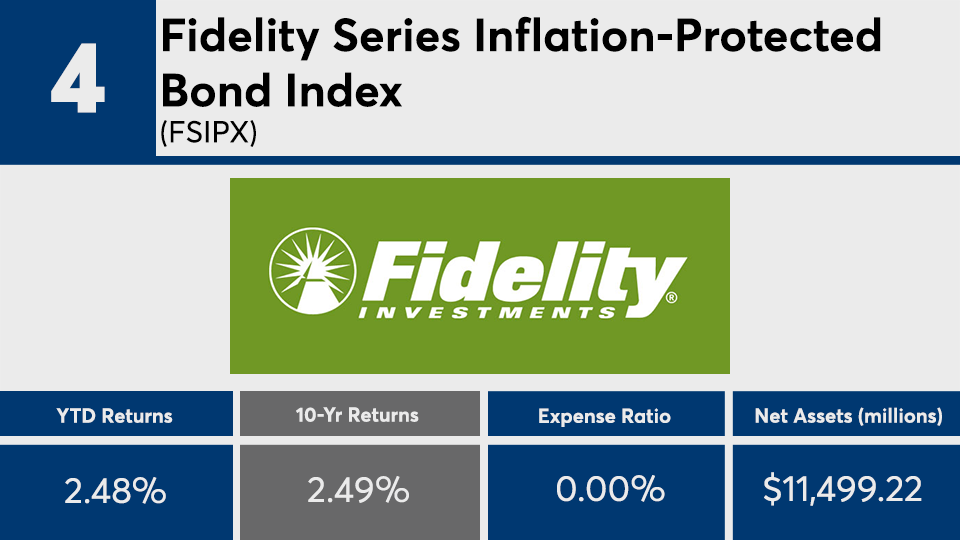
FP050320_4.png

Fidelity Series Inflation-Protected Bond Index (FSIPX)

1-Yr. Return: 6.28%
3-Yr. Annualized Return: 3.13%
5-Yr. Annualized Return: 2.36%
FP050320_3.png

Vanguard Short-Term Treasury ETF (VGSH)

1-Yr. Return: 5.28%
3-Yr. Annualized Return: 2.60%
5-Yr. Annualized Return: 1.77%
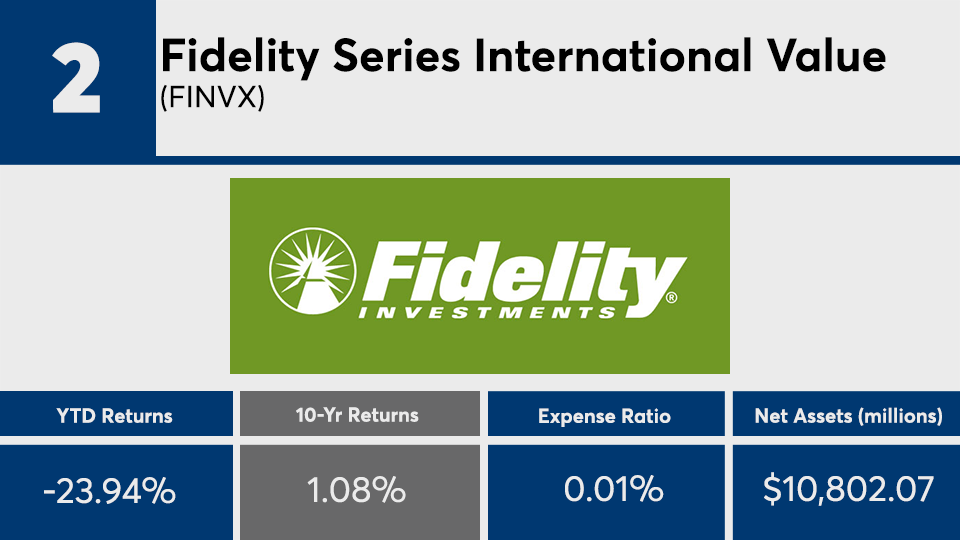
FP050320_2.png

Fidelity Series International Value (FINVX)

1-Yr. Return: -18.18%
3-Yr. Annualized Return: -5.51%
5-Yr. Annualized Return: -3.74%
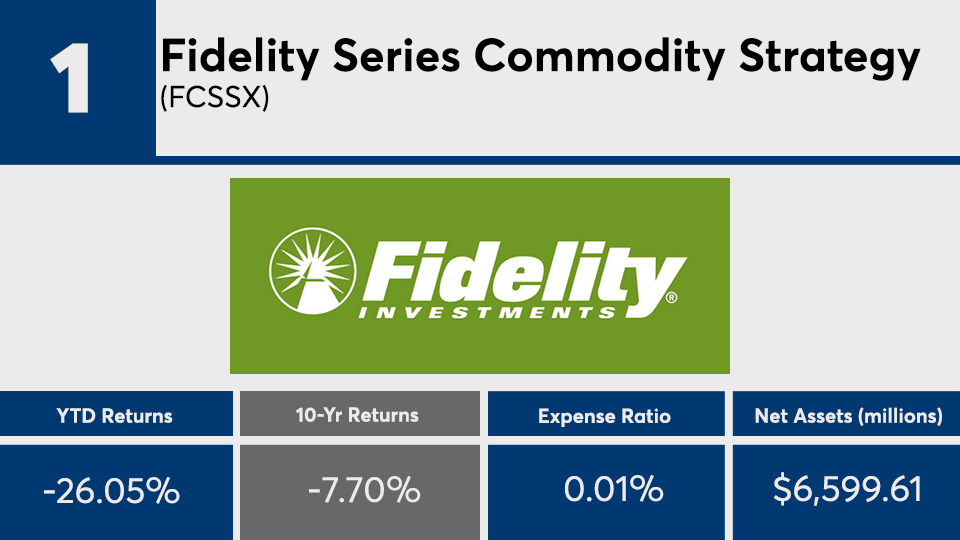
FP050320_1.png

Fidelity Series Commodity Strategy (FCSSX)

1-Yr. Return: -24.91%
3-Yr. Annualized Return: -9.44%
5-Yr. Annualized Return: -9.49%
MORE FROM FINANCIAL PLANNING