Tax-efficient funds with the best 10-year returns

Tax-efficient funds with the best returns of the decade managed to outpace the broader industry. But does that mean it’s a good long-term strategy?

The 20 mutual funds and ETFs with tax-cost ratios lower than their peers generated an average 10-year gain of 14.89%, according to Morningstar Direct data. So far this year, the same funds delivered returns as high as 44%, and an average gain of more than twice the industry average.

For comparison, index trackers such as the SPDR S&P 500 ETF Trust (SPY) and the SPDR Dow Jones Industrial Average ETF Trust (DIA) posted 10-year returns of 13.49% and 12.31%, respectively, over the same period. Year-to-date, SPY and DIA reported gains of just 0.63% and 7.97%, respectively.

In bonds, the AGG has generated gains of 6.37% and 3.48% over the YTD and 10-year periods.

Though their returns are enough to account for overall outperformance, James Bruderman, president of Bruderman Asset Management and vice chairman of 1879 Advisors, says advisors and clients must consider the cost as well as the risks that come with chasing tax efficiency.

“Clients have got to invest for the long term,” Bruderman says, stressing that while it’s “not a bad idea to defer taxes, they shouldn't be afraid of taxes for the sake of performance.”

Fees among the top-performers, a mix of mutual funds and ETFs with an average tax-cost ratio of 0.70%, ranged from as little two basis points to as high as 1.25%, data show. With an average fee of 0.38%, however, they were generally less than the 0.45% investors paid for fund investing last year, according to Morningstar’s most recent annual fee survey.

“Some of these funds are charging high fees to do the tax investment strategy and also pick the stocks,” Bruderman says, adding that the funds are also limited “by picking stocks because of the constraints of the tax strategy.”

Scroll through to see the 20 tax-efficient mutual funds and ETFs with the best 10-year returns through Oct. 22. Funds on this list adhere to Morningstar's tax-efficient funds methodology (Gold analyst rating, month-end tax-cost ratios below the category average and no loads). Leveraged and institutional funds are excluded. Assets and expense ratios, as well as YTD, one-, three- and five- returns are also listed for each. The data show each fund's primary share class. Tax-cost ratio data as of Sept. 30. All data is from Morningstar Direct.

FP102620_20 copy.png

DFA US Large Company I (DFUSX)

1-Yr. Return: 16.37%
3-Yr. Annualized Return: 12.19%
5-Yr. Annualized Return: 13.43%
FP102620_19 copy.png

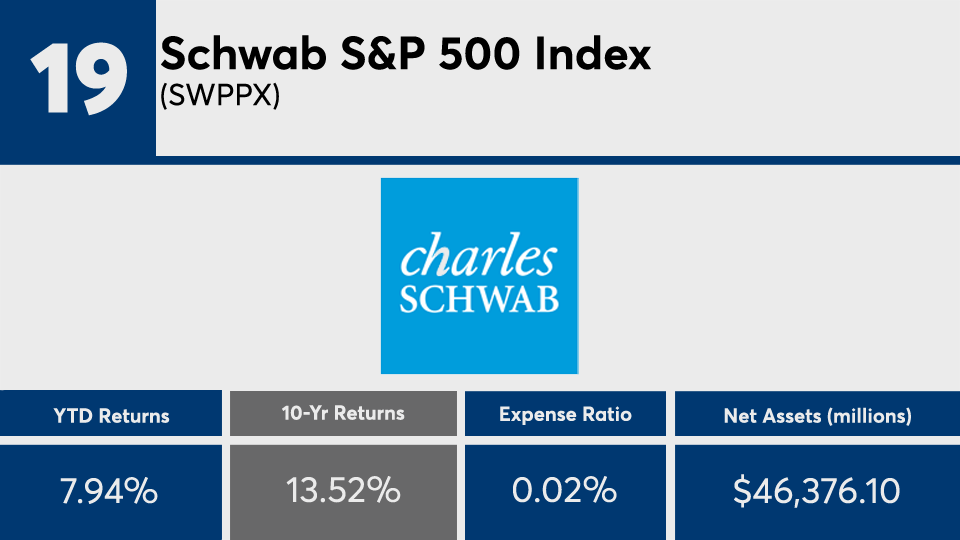
Schwab S&P 500 Index (SWPPX)

1-Yr. Return: 16.44%
3-Yr. Annualized Return: 12.22%
5-Yr. Annualized Return: 13.43%
FP102620_18 copy.png

iShares Core S&P 500 ETF (IVV)

1-Yr. Return: 16.41%
3-Yr. Annualized Return: 12.22%
5-Yr. Annualized Return: 13.44%
FP102620_17 copy.png

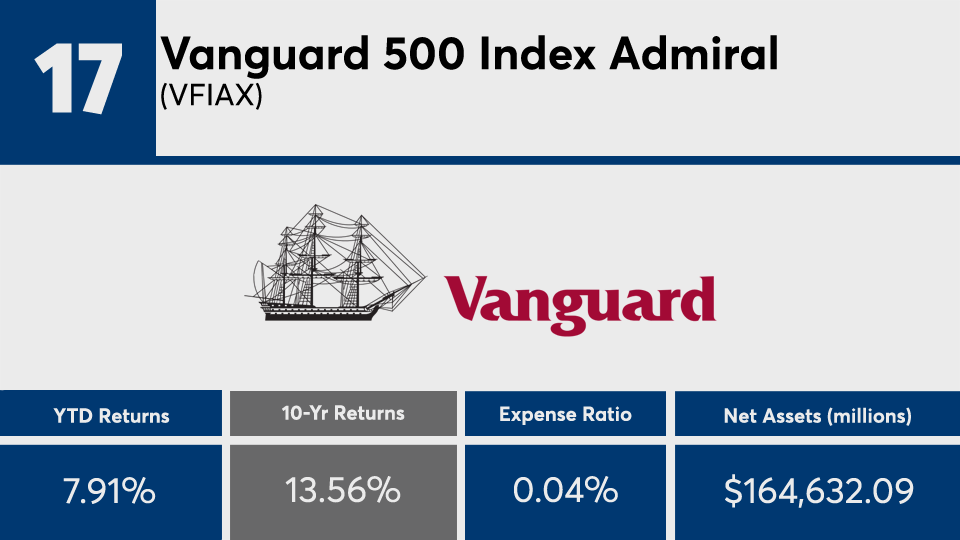
Vanguard 500 Index Admiral (VFIAX)

1-Yr. Return: 16.4%
3-Yr. Annualized Return: 12.21%
5-Yr. Annualized Return: 13.45%
FP102620_16 copy.png

Vanguard Small-Cap Growth ETF (VBK)

1-Yr. Return: 23.17%
3-Yr. Annualized Return: 13.97%
5-Yr. Annualized Return: 14.02%
FP102620_15 copy.png

Schwab US Large-Cap ETF (SCHX)

1-Yr. Return: 17.91%
3-Yr. Annualized Return: 12.63%
5-Yr. Annualized Return: 13.66%
FP102620_14 copy.png

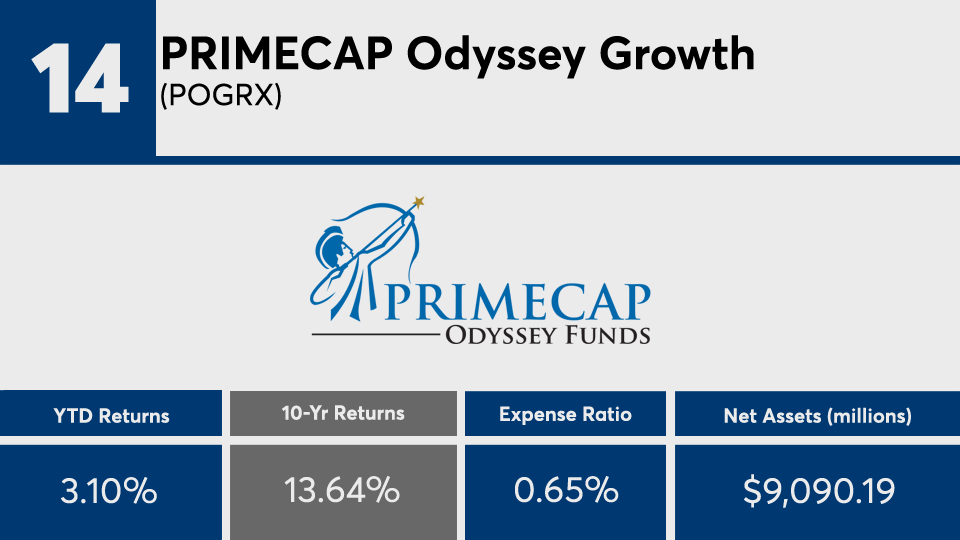
PRIMECAP Odyssey Growth (POGRX)

1-Yr. Return: 15%
3-Yr. Annualized Return: 8.92%
5-Yr. Annualized Return: 13.04%
FP102620_13 copy.png

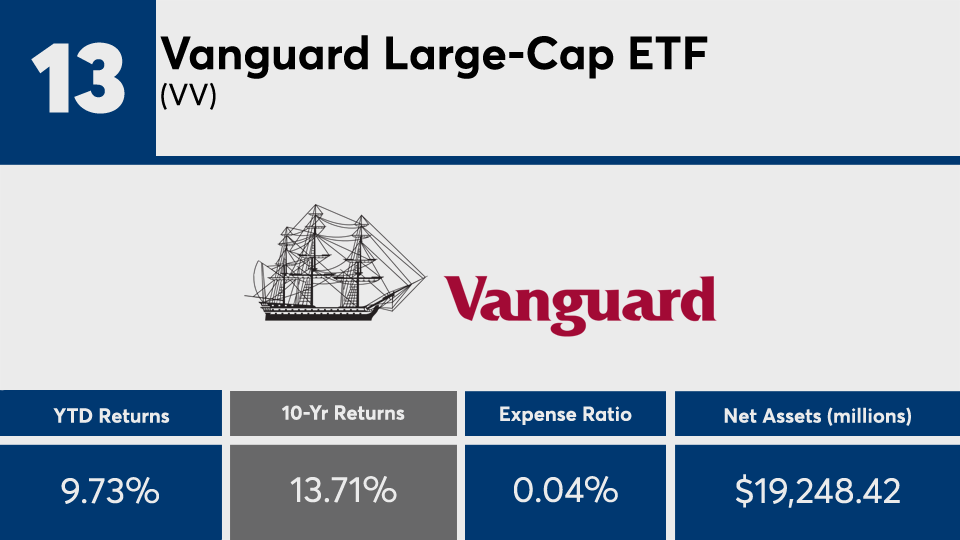
Vanguard Large-Cap ETF (VV)

1-Yr. Return: 18.4%
3-Yr. Annualized Return: 12.81%
5-Yr. Annualized Return: 13.77%
FP102620_12 copy.png

Vanguard Tax-Managed Capital Appreciation Admiral (VTCLX)

1-Yr. Return: 17.67%
3-Yr. Annualized Return: 12.46%
5-Yr. Annualized Return: 13.68%
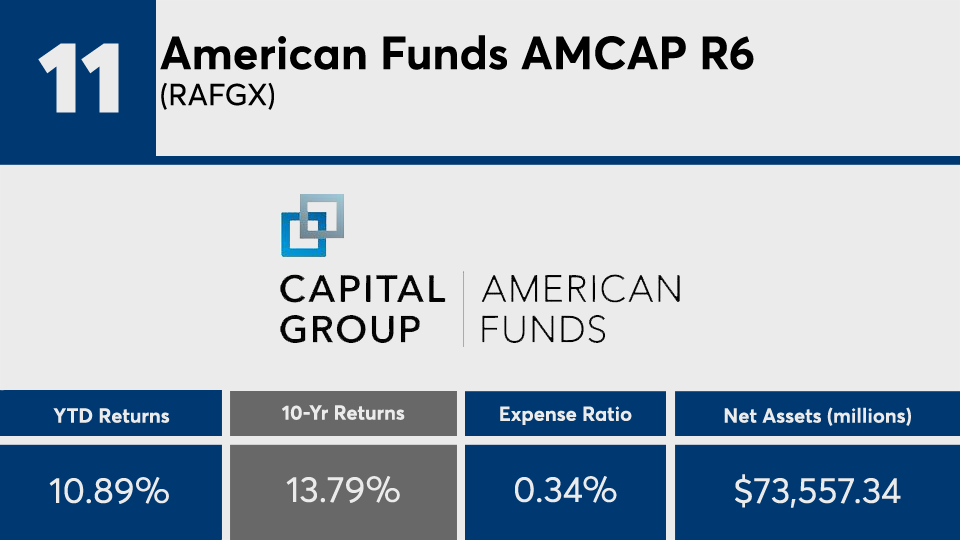
FP102620_11 copy.png

American Funds AMCAP R6 (RAFGX)

1-Yr. Return: 21.96%
3-Yr. Annualized Return: 12.77%
5-Yr. Annualized Return: 13.51%
FP102620_10 copy.png

Vanguard Mid-Cap Growth ETF (VOT)

1-Yr. Return: 25.95%
3-Yr. Annualized Return: 15.46%
5-Yr. Annualized Return: 14.18%
FP102620_09 copy.png

T. Rowe Price QM US Small-Cap Growth Equity (PRDSX)

1-Yr. Return: 14.07%
3-Yr. Annualized Return: 10.74%
5-Yr. Annualized Return: 12.47%
FP102620_08 copy.png

Vanguard PRIMECAP Admiral (VPMAX)

1-Yr. Return: 16.32%
3-Yr. Annualized Return: 10.92%
5-Yr. Annualized Return: 14.42%
FP102620_07 copy.png

Wasatch Core Growth (WGROX)

1-Yr. Return: 23.17%
3-Yr. Annualized Return: 15.68%
5-Yr. Annualized Return: 15.16%
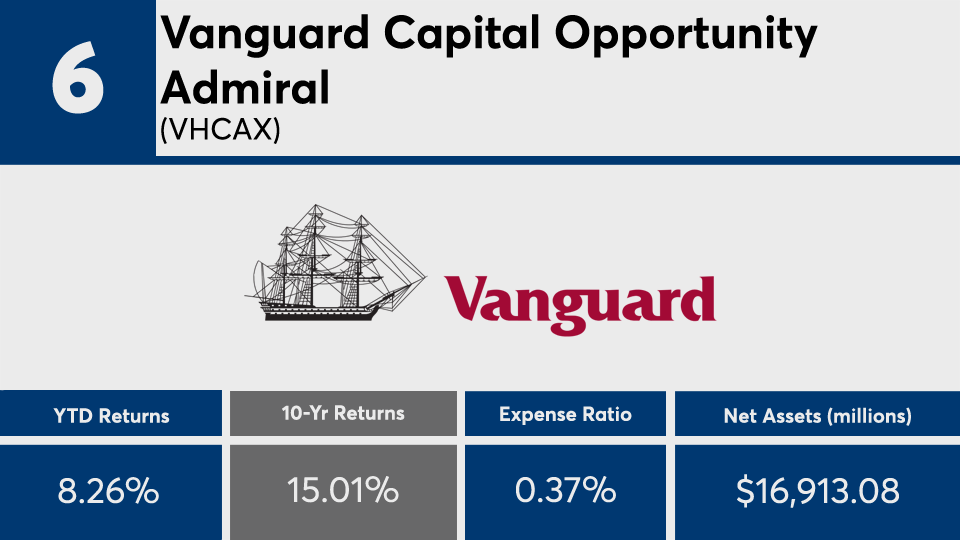
FP102620_06 copy.png

Vanguard Capital Opportunity Admiral (VHCAX)

1-Yr. Return: 20.91%
3-Yr. Annualized Return: 10.92%
5-Yr. Annualized Return: 14.74%
FP102620_05 copy.png

Vanguard Growth ETF (VUG)

1-Yr. Return: 39.54%
3-Yr. Annualized Return: 21.2%
5-Yr. Annualized Return: 18.62%
FP102620_04 copy.png

PRIMECAP Odyssey Aggressive Growth (POAGX)

1-Yr. Return: 24.45%
3-Yr. Annualized Return: 11.61%
5-Yr. Annualized Return: 15.38%
FP102620_03 copy.png

Brown Capital Management Small Company Investor (BCSIX)

1-Yr. Return: 35.32%
3-Yr. Annualized Return: 18.23%
5-Yr. Annualized Return: 18.74%
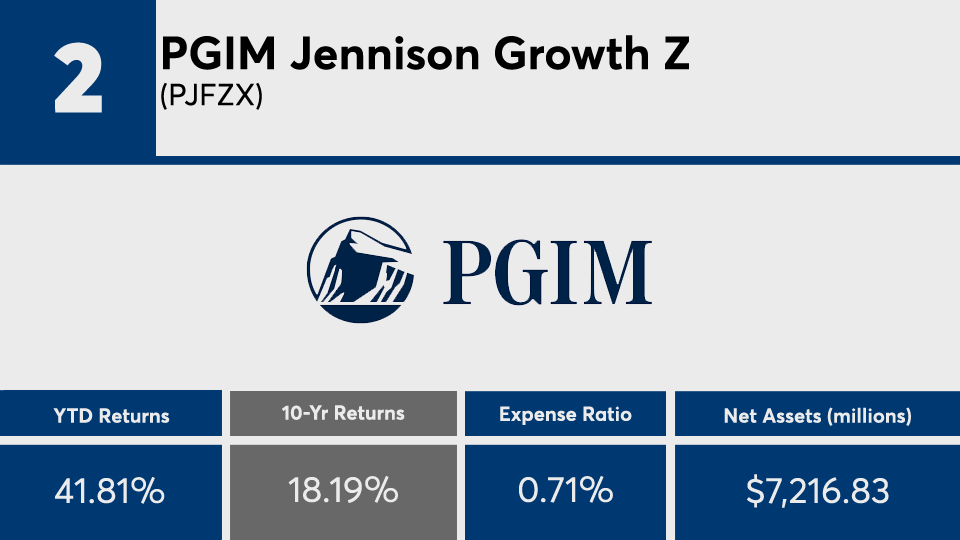
FP102620_02 copy.png

PGIM Jennison Growth Z (PJFZX)

1-Yr. Return: 57.28%
3-Yr. Annualized Return: 25%
5-Yr. Annualized Return: 21.35%
FP102620_01 copy.png

T. Rowe Price Communications & Technology Investor (PRMTX)

1-Yr. Return: 54.07%
3-Yr. Annualized Return: 25.04%
5-Yr. Annualized Return: 23.19%
MORE FROM FINANCIAL PLANNING