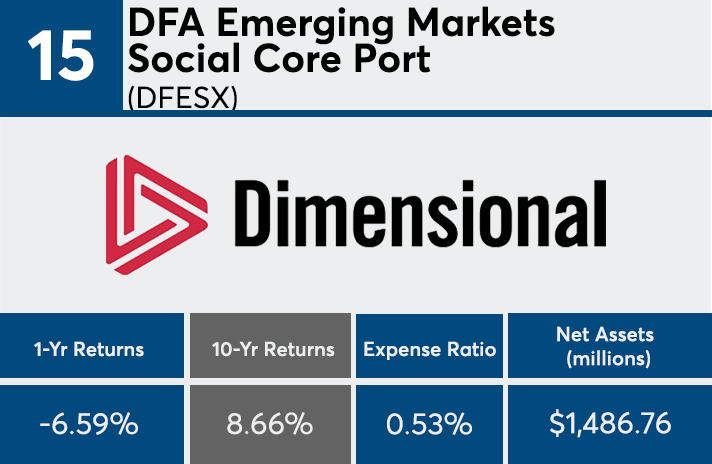
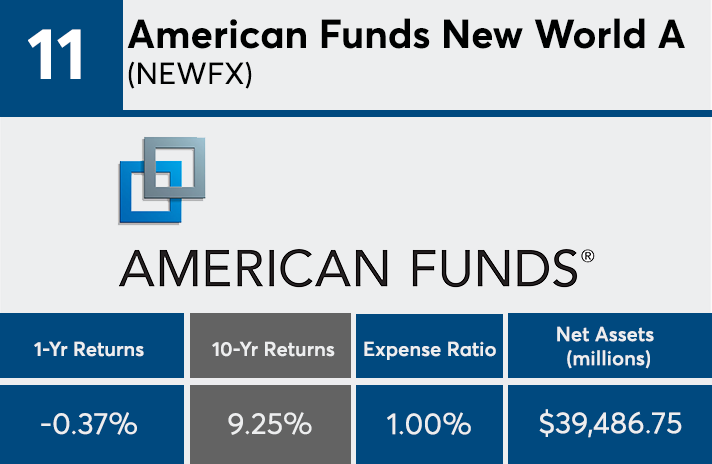
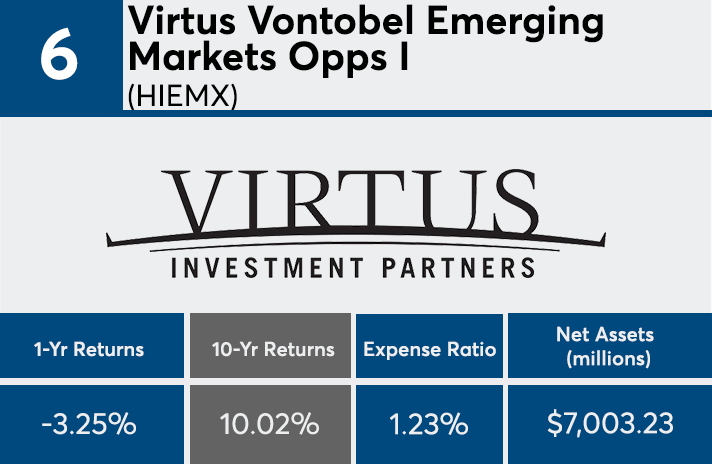
Although most of the industry’s 20 top-performing emerging markets funds posted a loss over the last 12 months, they all had 10-year returns well over 7%.
“Emerging market investing requires a strong stomach as there are lots of ups and downs,” says Greg McBride, chief financial analyst at Bankrate. “To realize the diversification benefits and potentially higher returns of faster growing emerging markets means looking through a long-term lens, not the performance of a single year.”
While the MSCI Emerging Markets Index had a 5% year-over-year loss, as measured by the iShares MSCI Emerging Markets ETF (EEM), it reported a 10-year gain of nearly 7.13%. With an average one-year loss of 3.67% and 10-year returns ranging from just under 8% to more than 11%, the 20 top-performers experienced a similar trend, according to Morningstar Direct data.
The leaders, which are home to $159 billion in combined assets, came at a significantly higher cost to investors than the average fund. Expense ratios attached to the top 20 performers were 108 basis points on average; more than twice the 0.52% investors paid on average for fund investing in 2017, according to Morningstar’s most recent annual fee survey, which reviewed the asset-weighted average expense ratios of nearly 25,000 U.S. mutual funds and ETFs.
“Expense ratios are higher for emerging market funds than those in developed international markets or here in the U.S.,” McBride notes. “Research costs are higher in emerging markets because companies may not have a current analyst, following the accounting can be tough to decipher or verify, and getting to far-flung less-developed locales to do on-the-ground research can be pricey. All that adds up.”
When it comes to returns, size isn’t necessarily the best predictor of performance. The industry’s largest emerging markets category fund, the Vanguard FTSE Emerging Markets ETF (VWO), had a 7.85% 10-year return and loss of 2.87% over the past year. VWO has a net expense ratio of 12 basis points. A similar screen of the largest 20 emerging markets funds, home to $308.2 billion in AUM, rendered an average 8.94% 10-year return and 2.43% loss over the past year. These funds had an average expense ratio of 0.87%.
For advisors with clients worried about the year's lagging performance, McBride warns that the pricey category is vulnerable to market swings. “Last year was a bumpy year in financial markets,” says McBride. “Volatility was heightened in riskier asset classes such as emerging markets.”
Scroll through to see the 20 emerging markets category funds ranked by the highest 10-year returns through April 21. Funds with less than $100 million in AUM and investment minimums over $100,000 were excluded, as were leveraged and institutional funds. Assets and expense ratios for each fund, as well as 1-year returns, are also listed. The data shows each fund's primary share class.


