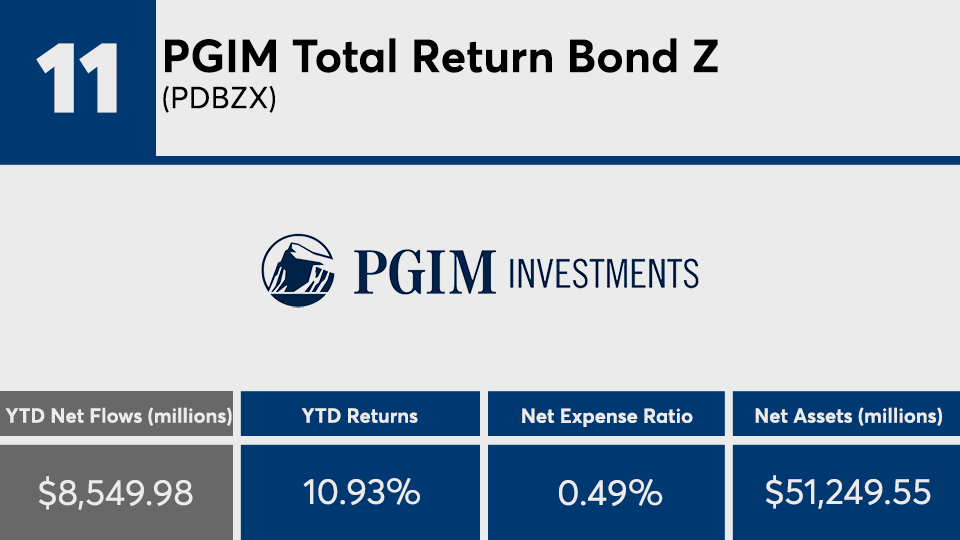
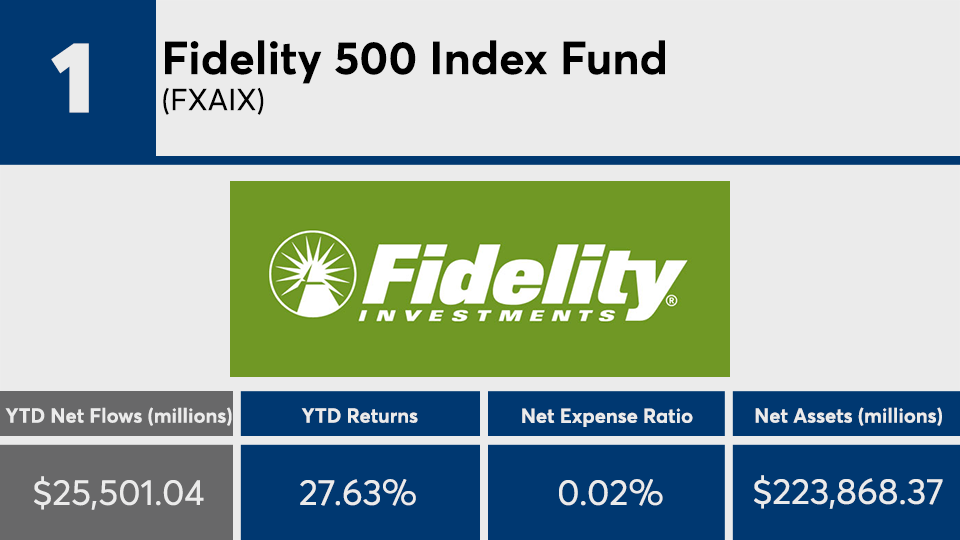
With an eye on market volatility and rate cuts from the Fed this year, the bond fund universe has seen a surge of new money.
The 20 mutual funds and ETFs with the largest year-to-date inflows are home to more than $2.5 trillion in combined assets under management, according to Morningstar Direct. These funds, mostly index-trackers, underline the continued trend toward low-cost investing, says Greg McBride, senior financial analyst at Bankrate.
“The largest inflows reveal the move toward passive investing with index mutual funds and ETFs dominating the list and representing the lion’s share of inflows,” McBride says.
Investors have been drawn to fixed income this year more than last year. Nine of the funds in this ranking were bond funds; carrying nearly $75 billion of the combined $200 billion of inflows among the top 20. That is up from six funds and roughly $58 billion in combined credit assets that made the list in 2018. “In October, U.S. equity funds had outflows of $14.8 billion, taking year-to-date outflows to $36.4 billion. Despite one of the longest bull markets in history, investors have contributed just a net $59.8 billion to U.S. equity funds over the past 10 years,” according to a recent report from Morningstar.
“All the net flows really are going to bond funds, whether you’re talking about taxable or muni bond funds,” explains Morningstar analyst Kevin McDevitt. “Whether it be U.S. sector or international, equity funds are all in outflows, as are alternatives and balanced funds.”
Considering the larger showing from the credit industry this year, McDevitt notes the impact on the net gains from the leaders. “You don’t see investors, en masse, chasing returns like they used to,” McDevitt says, adding, “There’s a lower correlation between flows and returns and there’s less performance chasing than you saw in the past, and that’s a positive thing.”
The funds recorded an average YTD gain of 14%, data show. When compared to the broader market, they were outpaced by the Dow’s 22.44% gain, as measured by the SPDR Dow Jones Industrial Average ETF (DIA), and the S&P 500’s 25.59% gain, as measured by the SPDR S&P 500 ETF (SPY), over the same period. The Barclays Capital U.S. Aggregate Bond Index, as measured by the iShares Core US Aggregate Bond ETF (AGG), reported a YTD gain of 8.64%.
With an average expense ratio of 0.14%, these funds were more than 30 basis points cheaper than the 0.48% investors were charged, on average, for fund investing last year, according to Morningstar’s most recent annual fee survey, which reviewed the asset-weighted average expense ratios of all U.S. open-end mutual funds and ETFs. The industry’s largest fund, the $845.4 billion Vanguard Total Stock Market Index Fund Admiral Shares (VTSAX), made it to the top 20 with more than $10 billion of net flows, a 0.14% expense ratio and a 27.16% YTD return, data show.
Scroll through to see the 20 mutual funds and ETFs with the largest inflows as of Dec. 1. Funds with less than $500 million in AUM and investment minimums over $100,000 were excluded, as were leveraged and institutional funds. Assets and expense ratios for each, as well as three-year net flows and year-to-date returns, are also listed. The data shows each fund's primary share class. All data from Morningstar Direct.


