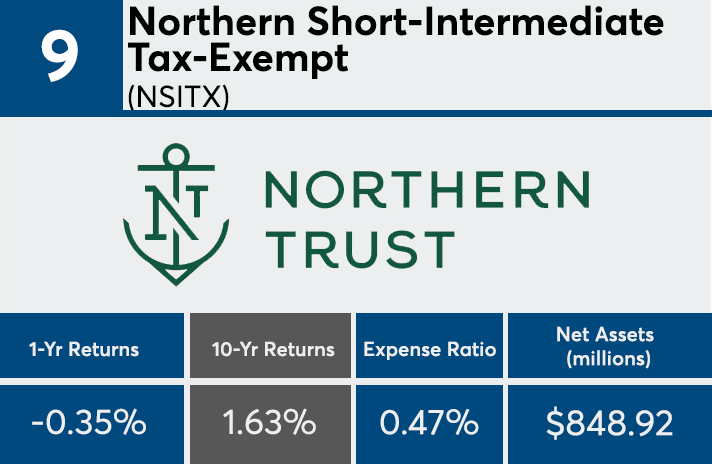
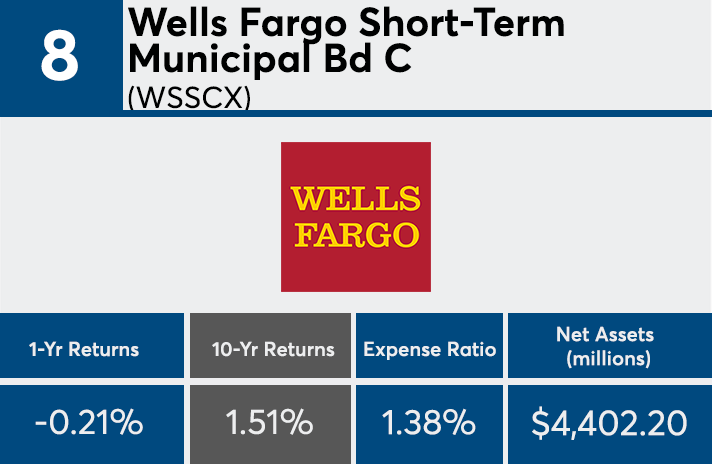
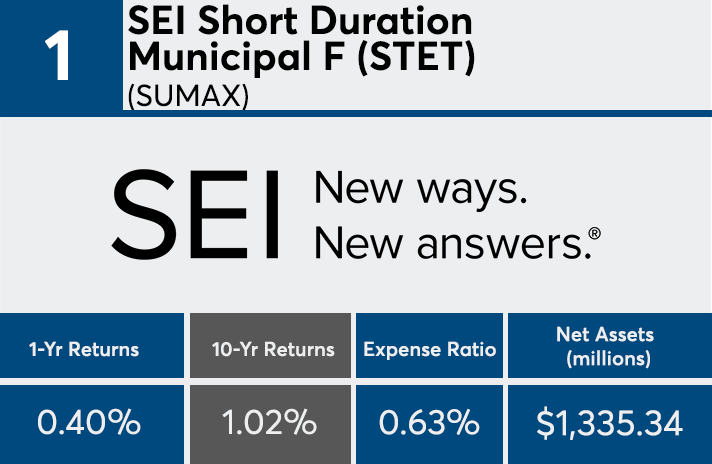
Over the past decade, the worst-performing municipal bond funds were … OK?
Overall, the 20 muni funds with the lowest 10-year annualized returns showed gains, even as recent headwinds have undercut growth, according to Morningstar data. Over the past year, higher interest rates, combined with October’s stock market volatility, have hurt the sector, says Greg McBride, chief financial analyst at Bankrate.
“Interest rates were falling over much of that 10-year period, so the underperforming funds will be those that hold bonds benefitting the least from declining rates,” McBride explains. “Shorter-maturity bonds have a lower interest rate sensitivity than longer-maturity — or higher-duration — bonds, so their prices show minimal improvement when interest rates decline.”
Returns among the 20 worst-performing funds in the category were a 1.78% annualized over the last decade, according to Morningstar Direct. But nine had losses over the last year. Those nine posted an average 10-year return of 0.03%.
When comparing fees, it paid to invest in the cheaper offerings, according to data. The worst-performing muni funds, which house a combined $72 billion in client assets, had an average expense ratio of 51 basis points. The top-performing funds, which had $46.9 billion in client assets, had an average expense ratio of 0.01%.
For advisors with clients invested in poorly performing products, McBride says it’s important to stress their long-term strategies.
“Don’t let performance prompt you to abandon an asset class that fits your long-term strategy but is currently out of favor,” he says.
Scroll through to see the 20 worst-performing muni bond funds over the past 10 years. Only funds with at least $500 million in assets were included. Institutional, leveraged and funds with over $100,000 investment minimums were excluded. We also show one-year returns, assets and expense ratios for each fund. All data is from Morningstar Direct.


