Worst mutual fund outflows over 15 years

Complimentary Access Pill
Enjoy complimentary access to top ideas and insights — selected by our editors.

Analysis of long-term mutual fund outflows reflects an industry in flux.

The 20 mutual funds with the biggest net outflows of the past 15 years, and at least $100 million in assets under management, shed nearly $793.4 billion over the period, Morningstar Direct data show. In the past year, the same funds lost almost $83.5 billion.

Outflows aside, the same funds had a 15-year gain of nearly 8.9%. In the past year, the same funds averaged a return of around 70.98%.

When compared with broader index trackers, ETFs such as the SPDR S&P 500 ETF Trust (SPY) and the SPDR Dow Jones Industrial Average ETF (DIA) saw 15-year returns of 9.73% and 9.87%, respectively, data show. In the past 12 months, SPY and DIA have seen gains of 65.66% and 67.07%, respectively.

In bonds, the iShares Core U.S. Aggregate Bond ETF (AGG) had a 15-year return of 4.14% and one-year return of 3.95%.

There’s been a broad industry shift to passive and near-zero expense ratios, according to industry consultant Marc Pfeffer.

“If you threw a dart at almost anything in the last year in equities, it would be hard to find something that has been losing money,” Pfeffer says. “I just think there's been a general trend in the last 15 years to low-cost funds. All of these seem to be negative in flows on all time frames. This has been a trend that's been going on for a while and it’s been picking up speed.”

Fee analysis shows that while many mutual funds with big outflows have notched sizable gains, there is a stark contrast in overall fees from funds with the biggest net inflows over the same period. Funds here carry net expense ratios ranging from as high as 105 basis. The funds have an average of roughly 0.70%, well above the 0.45% investors paid for fund investing in 2019, according to Morningstar’s most recent annual fee survey.

“Even if you look at the performance on some of these funds, they're not bad. These are reputable funds,” Pfeffer says, adding, however, “if you look at their expense ratios, you don’t see anything with less than 50 basis points on here.”

Scroll through to see the 20 mutual funds, with more than $100 million in AUM, and the biggest month-end 15-year net outflows through March 1. Assets and average expense ratios, as well as year-to-date, one-, three-, five, 10- and 15-year returns through March 19 are also listed for each. The data show each fund's primary share class. All data is from Morningstar Direct.

FP032221_20 copy.png
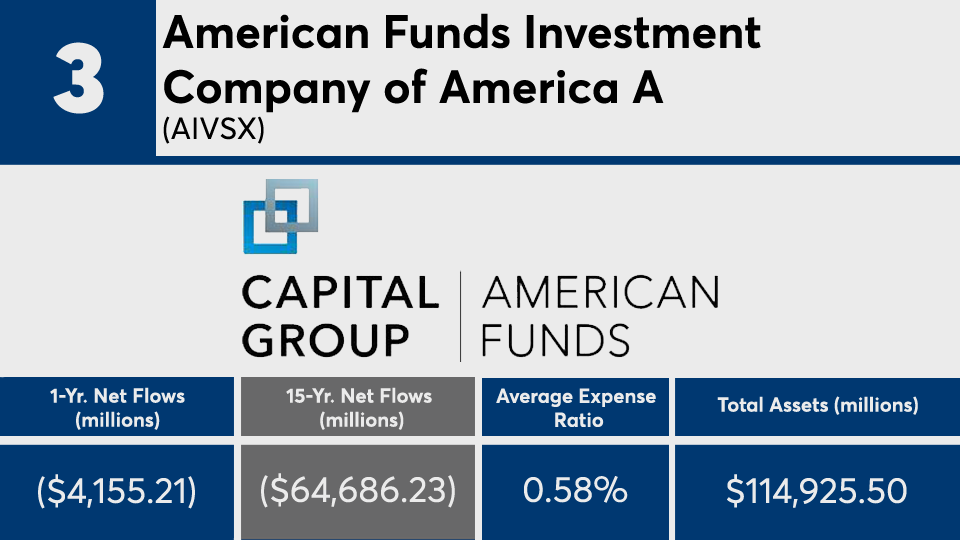
YTD Return: 13.31%; 1-Yr. Return: 83.45%; 3-Yr. Annualized Return: 12.58%; 5-Yr. Annualized Return: 15.76%; 10-Yr. Annualized Return: 11.93%; 15-Yr. Annualized Return: 8.11%; YTD Net Flow: (millions): ($150.05); 3-Yr. Net Flow (millions): ($1,810.47); 5-Yr. Net Flow (millions): ($4,525.27); 10-Yr. Net Flow (millions): ($21,681.10); Front Load: 4.75%; Minimum Initial Investment: $1,000; Inception Date: Feb. 17, 1969
FP032221_19 copy.png
YTD Return: 10.16%; 1-Yr. Return: 60.8%; 3-Yr. Annualized Return: 10.57%; 5-Yr. Annualized Return: 12.13%; 10-Yr. Annualized Return: 10.6%; 15-Yr. Annualized Return: 7.57%; YTD Net Flow: (millions): ($205.54); 3-Yr. Net Flow (millions): ($4,939.69); 5-Yr. Net Flow (millions): ($6,674.17); 10-Yr. Net Flow (millions): ($13,315.05); Minimum Initial Investment: $2,500; Inception Date: June 26, 1931
FP032221_18 copy.png
YTD Return: 8.2%; 1-Yr. Return: 57.58%; 3-Yr. Annualized Return: 11.6%; 5-Yr. Annualized Return: 12.04%; 10-Yr. Annualized Return: 10.08%; 15-Yr. Annualized Return: 6.84%; YTD Net Flow: (millions): $0.75; 3-Yr. Net Flow (millions): ($805.96); 5-Yr. Net Flow (millions): ($2,980.18); 10-Yr. Net Flow (millions): ($9,216.83); Inception Date: May 16, 1966
FP032221_17 copy.png
YTD Return: 12.77; 1-Yr. Return: 72.66; 3-Yr. Annualized Return: 9.62; 5-Yr. Annualized Return: 12.01; 10-Yr. Annualized Return: 10.36; 15-Yr. Annualized Return: 7.53; YTD Net Flow: (millions): -370.31; 3-Yr. Net Flow (millions): -5,148.50; 5-Yr. Net Flow (millions): -14,807.30; 10-Yr. Net Flow (millions): -22,350.32; Minimum Initial Investment: $2,500; Inception Date: Oct. 31, 1985
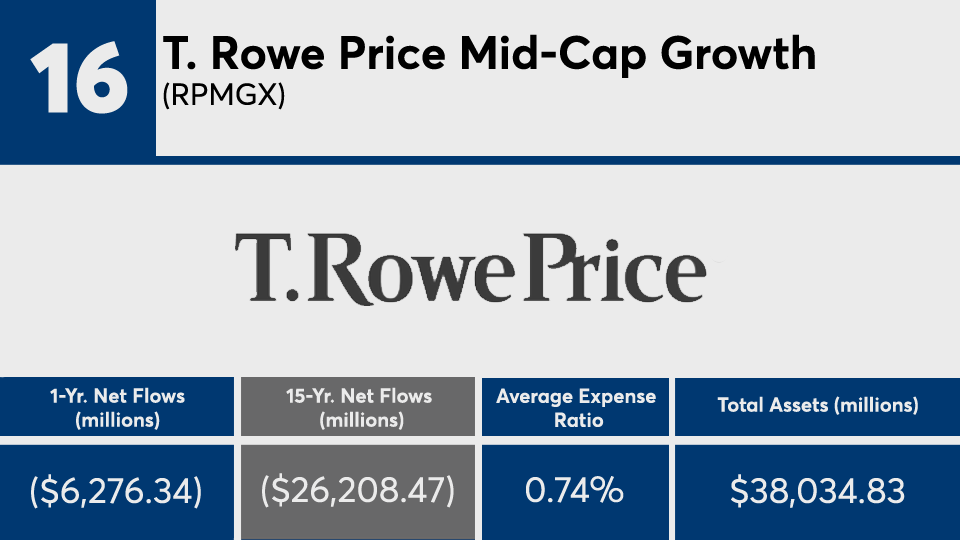
FP032221_16 copy.png
YTD Return: 2.61%; 1-Yr. Return: 81.52%; 3-Yr. Annualized Return: 15.65%; 5-Yr. Annualized Return: 17.31%; 10-Yr. Annualized Return: 14.59%; 15-Yr. Annualized Return: 11.91%; YTD Net Flow: (millions): ($479.23); 3-Yr. Net Flow (millions): ($11,201.50); 5-Yr. Net Flow (millions): ($15,962.60); 10-Yr. Net Flow (millions): ($24,219.00); Minimum Initial Investment: $2,500; Inception Date: June 30, 1992
FP032221_15 copy.png
YTD Return: 4.57%; 1-Yr. Return: 38.02%; 3-Yr. Annualized Return: 6.37%; 5-Yr. Annualized Return: 6.8%; 10-Yr. Annualized Return: 6.97%; 15-Yr. Annualized Return: 5.79%; YTD Net Flow: (millions): ($766.72); 3-Yr. Net Flow (millions): ($15,638.91); 5-Yr. Net Flow (millions): ($25,598.20); 10-Yr. Net Flow (millions): ($33,608.38); Front Load: 5.75%; Minimum Initial Investment: $250; Inception Date: July 30, 1987
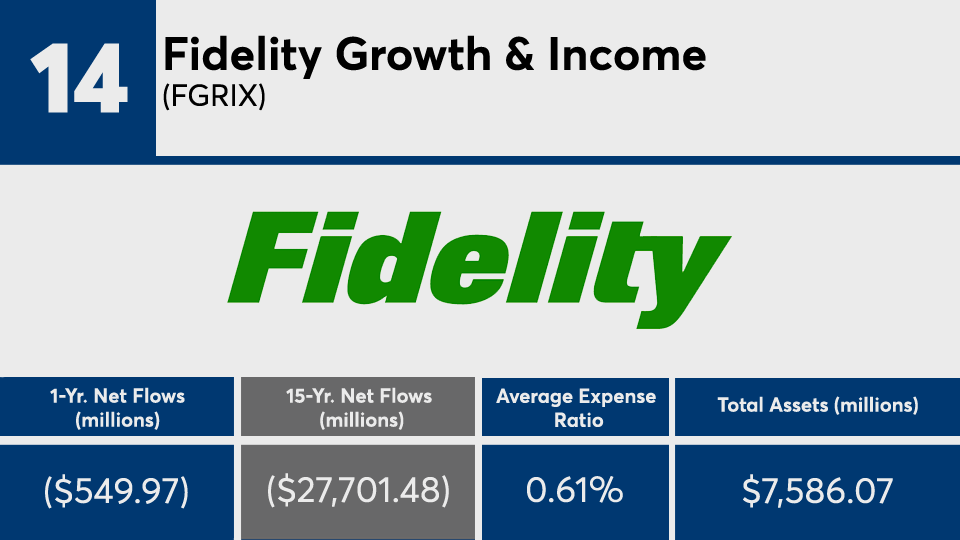
FP032221_14 copy.png
YTD Return: 10.73%; 1-Yr. Return: 68.22%; 3-Yr. Annualized Return: 12.86%; 5-Yr. Annualized Return: 14%; 10-Yr. Annualized Return: 12.64%; 15-Yr. Annualized Return: 6.23%; YTD Net Flow: (millions): ($84.69); 3-Yr. Net Flow (millions): ($1,597.36); 5-Yr. Net Flow (millions): ($2,596.76); 10-Yr. Net Flow (millions): ($5,606.89); Inception Date: Dec. 30, 1985
FP032221_13 copy.png
YTD Return: 5.11%; 1-Yr. Return: 41.41%; 3-Yr. Annualized Return: 8.13%; 5-Yr. Annualized Return: 8.75%; 10-Yr. Annualized Return: 8.56%; 15-Yr. Annualized Return: 6.92%; YTD Net Flow: (millions): ($768.05); 3-Yr. Net Flow (millions): ($13,115.94); 5-Yr. Net Flow (millions): ($22,841.93); 10-Yr. Net Flow (millions): ($27,735.25); Front Load: 5.75%; Minimum Initial Investment: $250; Inception Date: Nov. 30, 1973
FP032221_12 copy.png
YTD Return: 0.19%; 1-Yr. Return: 65.64%; 3-Yr. Annualized Return: 9.67%; 5-Yr. Annualized Return: 10.52%; 10-Yr. Annualized Return: 7.5%; 15-Yr. Annualized Return: 5.17%; YTD Net Flow: (millions): ($149.73); 3-Yr. Net Flow (millions): ($2,937.06); 5-Yr. Net Flow (millions): ($6,257.85); 10-Yr. Net Flow (millions): ($21,396.44); Inception Date: Dec. 27, 1991
FP032221_11 copy.png
YTD Return: 1.69%; 1-Yr. Return: 84.11%; 3-Yr. Annualized Return: 16.71%; 5-Yr. Annualized Return: 17.6%; 10-Yr. Annualized Return: 12.89%; 15-Yr. Annualized Return: 10.17%; YTD Net Flow: (millions): ($163.83); 3-Yr. Net Flow (millions): ($5,451.29); 5-Yr. Net Flow (millions): ($11,617.76); 10-Yr. Net Flow (millions): ($21,366.18); Front Load: 5.75%; Minimum Initial Investment: $250; Inception Date: March 13, 1973
FP032221_10 copy.png
YTD Return: 2.07%; 1-Yr. Return: 79.95%; 3-Yr. Annualized Return: 18.81%; 5-Yr. Annualized Return: 21.2%; 10-Yr. Annualized Return: 17.05%; 15-Yr. Annualized Return: 12.24%; YTD Net Flow: (millions): ($345.37); 3-Yr. Net Flow (millions): ($26,519.99); 5-Yr. Net Flow (millions): ($40,995.72); 10-Yr. Net Flow (millions): ($45,609.39); Minimum Initial Investment: $2,500; Inception Date: April 11, 1950
FP032221_09 copy.png
YTD Return: 4.09%; 1-Yr. Return: 66.58%; 3-Yr. Annualized Return: 9.69%; 5-Yr. Annualized Return: 12.39%; 10-Yr. Annualized Return: 9.63%; 15-Yr. Annualized Return: 7.56%; YTD Net Flow: (millions): ($571.87); 3-Yr. Net Flow (millions): ($12,782.34); 5-Yr. Net Flow (millions): ($23,403.68); 10-Yr. Net Flow (millions): ($42,099.05); Front Load: 5.75%; Minimum Initial Investment: $250; Inception Date: March 26, 1993
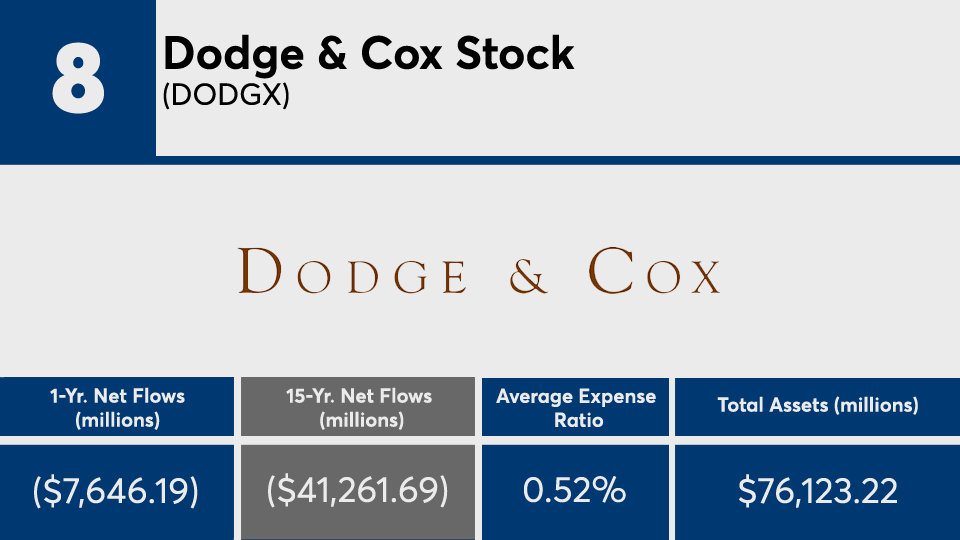
FP032221_08 copy.png
YTD Return: 16.28%; 1-Yr. Return: 89.83%; 3-Yr. Annualized Return: 12.6%; 5-Yr. Annualized Return: 15.85%; 10-Yr. Annualized Return: 13.35%; 15-Yr. Annualized Return: 8.5%; YTD Net Flow: (millions): ($1,078.76); 3-Yr. Net Flow (millions): ($14,270.26); 5-Yr. Net Flow (millions): ($20,237.44); 10-Yr. Net Flow (millions): ($33,044.56); Minimum Initial Investment: $2,500; Inception Date: Jan. 4, 1965
FP032221_07 copy.png
YTD Return: 2.4%; 1-Yr. Return: 113.39%; 3-Yr. Annualized Return: 27.38%; 5-Yr. Annualized Return: 28.87%; 10-Yr. Annualized Return: 20.66%; 15-Yr. Annualized Return: 15.13%; YTD Net Flow: (millions): ($774.21); 3-Yr. Net Flow (millions): ($6,881.56); 5-Yr. Net Flow (millions): ($13,708.94); 10-Yr. Net Flow (millions): ($35,602.29); Inception Date: Jan. 17, 1983
FP032221_06 copy.png
YTD Return: 13.94%; 1-Yr. Return: 89.4%; 3-Yr. Annualized Return: 11.65%; 5-Yr. Annualized Return: 12.59%; 10-Yr. Annualized Return: 11.86%; 15-Yr. Annualized Return: 9.25%; YTD Net Flow: (millions): ($118.06); 3-Yr. Net Flow (millions): ($10,221.91); 5-Yr. Net Flow (millions): ($15,632.23); 10-Yr. Net Flow (millions): ($28,615.98); Inception Date: Dec. 27, 1989
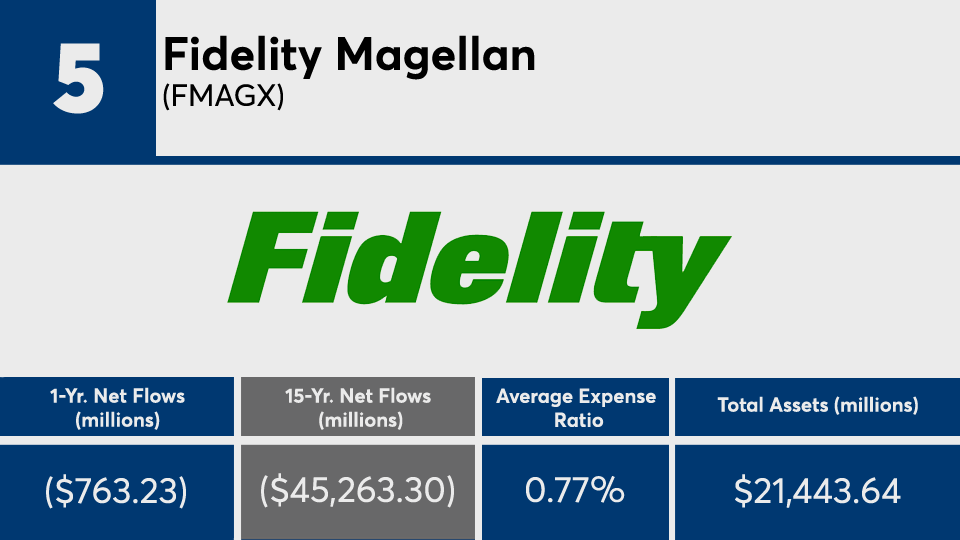
FP032221_05 copy.png
YTD Return: -1.99%; 1-Yr. Return: 57.23%; 3-Yr. Annualized Return: 14.43%; 5-Yr. Annualized Return: 16.41%; 10-Yr. Annualized Return: 13.17%; 15-Yr. Annualized Return: 8.46%; YTD Net Flow: (millions): ($137.98); 3-Yr. Net Flow (millions): ($1,827.12); 5-Yr. Net Flow (millions): ($4,251.91); 10-Yr. Net Flow (millions): ($16,130.14); Inception Date: May 2, 1963
FP032221_04 copy.png
YTD Return: 7.16%; 1-Yr. Return: 60.26%; 3-Yr. Annualized Return: 12%; 5-Yr. Annualized Return: 13.53%; 10-Yr. Annualized Return: 12.7%; 15-Yr. Annualized Return: 8.81%; YTD Net Flow: (millions): ($659.82); 3-Yr. Net Flow (millions): ($8,901.39); 5-Yr. Net Flow (millions): ($17,793.98); 10-Yr. Net Flow (millions): ($30,847.82); Front Load: 5.75%; Minimum Initial Investment: $250; Inception Date: July 31, 1952
FP032221_03 copy.png
YTD Return: 6.13; 1-Yr. Return: 62.35; 3-Yr. Annualized Return: 11.75; 5-Yr. Annualized Return: 13.53; 10-Yr. Annualized Return: 12.33; 15-Yr. Annualized Return: 8.65; YTD Net Flow: (millions): ($742.82); 3-Yr. Net Flow (millions): ($12,585.03); 5-Yr. Net Flow (millions): ($22,672.78); 10-Yr. Net Flow (millions): ($41,090.18); Front Load: 5.75%; Minimum Initial Investment: $250; Inception Date: Jan. 2, 1934
FP032221_02 copy.png
YTD Return: 1.95%; 1-Yr. Return: 80.41%; 3-Yr. Annualized Return: 18.17%; 5-Yr. Annualized Return: 19.87%; 10-Yr. Annualized Return: 15.38%; 15-Yr. Annualized Return: 10.73%; YTD Net Flow: (millions): ($922.33); 3-Yr. Net Flow (millions): ($12,656.84); 5-Yr. Net Flow (millions): ($26,517.83); 10-Yr. Net Flow (millions): ($53,482.39); Front Load: 5.75%; Minimum Initial Investment: $250; Inception Date: Nov. 30, 1973
FP032221_01 copy.png
YTD Return: 1.33%; 1-Yr. Return: 66.02%; 3-Yr. Annualized Return: 16.85%; 5-Yr. Annualized Return: 19.09%; 10-Yr. Annualized Return: 15.52%; 15-Yr. Annualized Return: 11.57%; YTD Net Flow: (millions): ($3,333.18); 3-Yr. Net Flow (millions): ($30,311.98); 5-Yr. Net Flow (millions): ($43,542.17); 10-Yr. Net Flow (millions): ($66,156.00); Inception Date: May 17, 1967
MORE FROM FINANCIAL PLANNING