Worst-performing actively managed funds of the last 10 years

Do poor-performing active funds come with hefty price tags? Not always.

The 20 actively managed funds with the worst returns of the decade posted an average 10-year loss of just under 2%, according to Morningstar Direct. These funds, which had at least $500 million in assets under management, had an average expense ratio of nearly 90 basis points, data show. While that’s nearly twice the broader industry’s average of 0.48%, they are right on par with some of the best performing active funds, according to Morningstar’s most recent annual fee survey, which reviewed the asset-weighted average expense ratios of all U.S. open-end mutual funds and ETFs.

What may be more confounding, however, is the worst-performer. With an expense ratio of nearly zero, the cost of this fund may seem to conflict with conventional wisdom about pricing. Marc Pfeffer, CIO of CLS Investments, says it’s simply a matter of holdings.

“This performance was not just predicated on expense ratios — the worst-performing fund here charged only 1 basis point,” Pfeffer says. “This was a commodity fund, and both commodities and energy were some of the worst sectors to be in over the last decade. This is a question of asset allocation.”

In a year marked by coronavirus-driven market volatility, data also show why being in the right sector can make a big difference in a down market. Pfeffer notes that while just over half of the decade’s worst-performing active funds have reported double-digit losses, many of the funds on this list have managed double-digit gains, year-to-date. Over the preceding 12 months, these same 20 funds have held onto a gain of nearly 12%.

“You want to be diversified,” Pfeffer says. “There’s nothing wrong with picking individual funds, but don't just pick one individual fund that tracks one individual sector.”

Compared with major index trackers, these funds’ performance lagged over the longer term. For example, the SPDR S&P 500 ETF Trust (SPY) notched a 10-year gain of 12.50%. The SPDR Dow Jones Industrial Average ETF Tracker (DIA) recorded a gain of 11.52%. Over the last year, these funds recorded a gain of 5.98 and loss of 2.35%, respectively. On the bonds side, the iShares Core US Aggregate Bond ETF (AGG) recorded a 10-year gain of 3.78% and 1-year gain of 5.06%, data show.

The largest overall fund, the $822.4 billion Vanguard Total Stock Market Index Admiral Shares (VTSAX), carried a 0.04% expense ratio and posted a 10-year return of 12.27%, data show. On the bonds side, the $264.2 billion Vanguard Total Bond Market Index Fund (VBTLX), had a 0.05% expense ratio and notched a 10-year gain of 3.82%. Over the last year, VTSAX and VBLTX posted gains of 4.28% and 10.37%, respectively.

“There's nothing wrong with active management,” Pfeffer says, adding that the key for advisors is “to look under the hood. There's nothing worse than being in an out-of-favor sector, having a bad manager and paying high fees for a fund.”

Scroll through to see the 20 actively managed funds with the worst 10-year gains through May 20. Funds with less than $500 million in AUM and investment minimums over $100,000 were excluded, as were leveraged and institutional funds. Assets and expense ratios, as well as year-to-date and one-, three-, five- and 10-year returns are listed for each. The data show each fund's primary share class. All data is from Morningstar Direct.
FP052120_20 copy.png

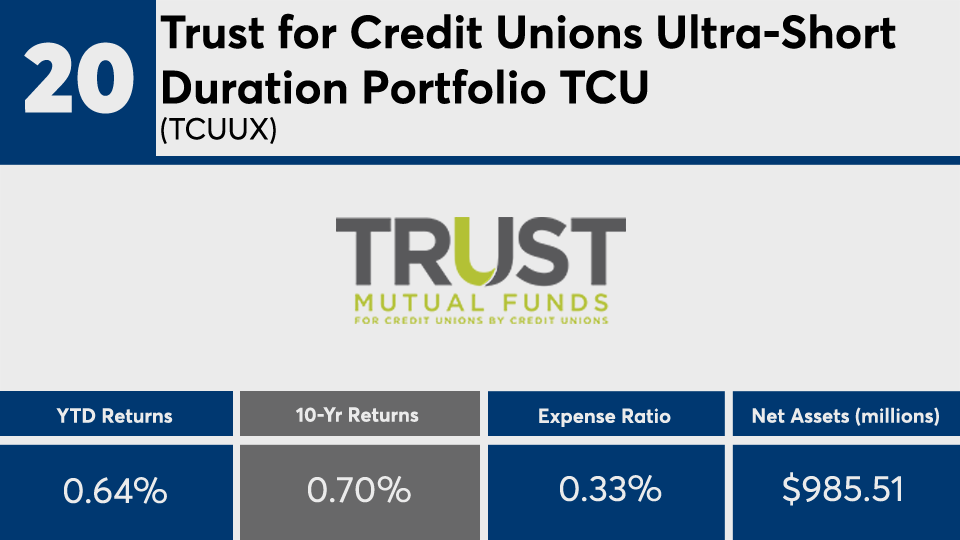
Trust for Credit Unions Ultra-Short Duration Portfolio TCU (TCUUX)

1-Yr. Return: 2.11%
3-Yr. Annualized Return: 1.61%
5-Yr. Annualized Return: 1.04%
FP052120_19 copy.png

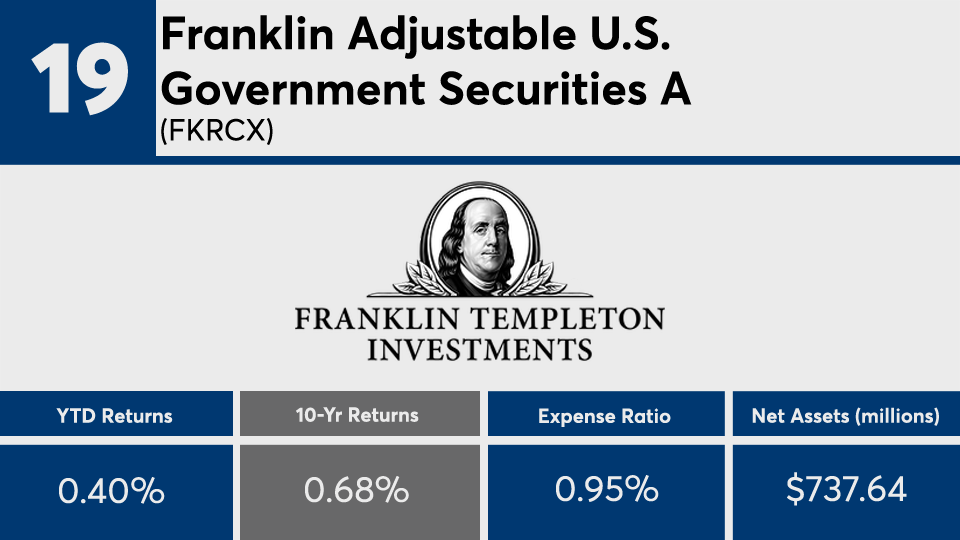
Franklin Adjustable U.S. Government Securities A (FISAX)

1-Yr. Return: 1.59%
3-Yr. Annualized Return: 1.06%
5-Yr. Annualized Return: 0.52%
Load: 2.25%
FP052120_18 copy.png

DFA Emerging Markets Value I (DFEVX)

1-Yr. Return: -17.38%
3-Yr. Annualized Return: -5.44%
5-Yr. Annualized Return: -2.52%
FP052120_17 copy.png

AB All Market Real Return 1 (AMTOX)

1-Yr. Return: -14.99%
3-Yr. Annualized Return: -3.69%
5-Yr. Annualized Return: -3.69%
FP052120_16 copy.png

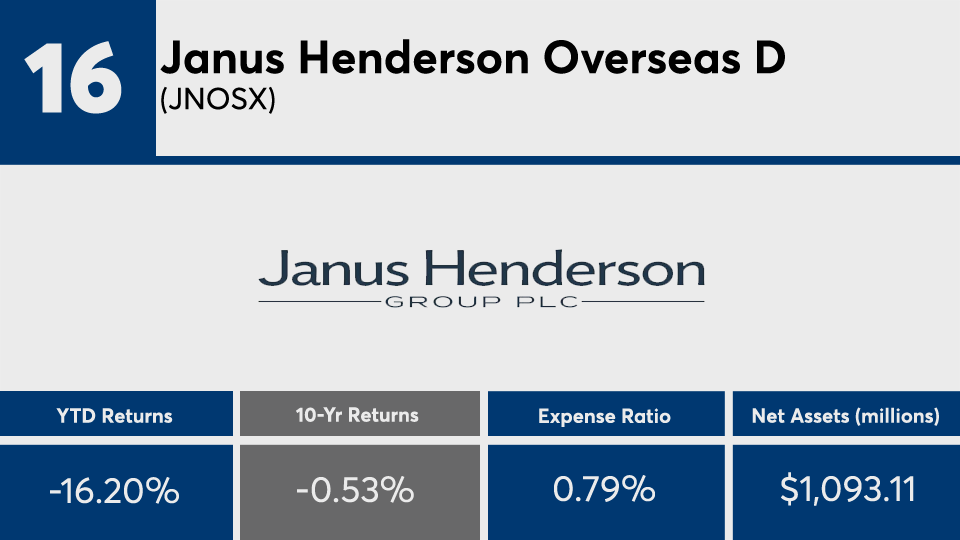
Janus Henderson Overseas D (JNOSX)

1-Yr. Return: -2.28%
3-Yr. Annualized Return: 0.14%
5-Yr. Annualized Return: -2.09%
FP052120_15 copy.png

Invesco Oppenheimer SteelPath MLP Select 40 Y (MLPTX)

1-Yr. Return: -40.23%
3-Yr. Annualized Return: -16.27%
5-Yr. Annualized Return: -11.96%
FP052120_14 copy.png

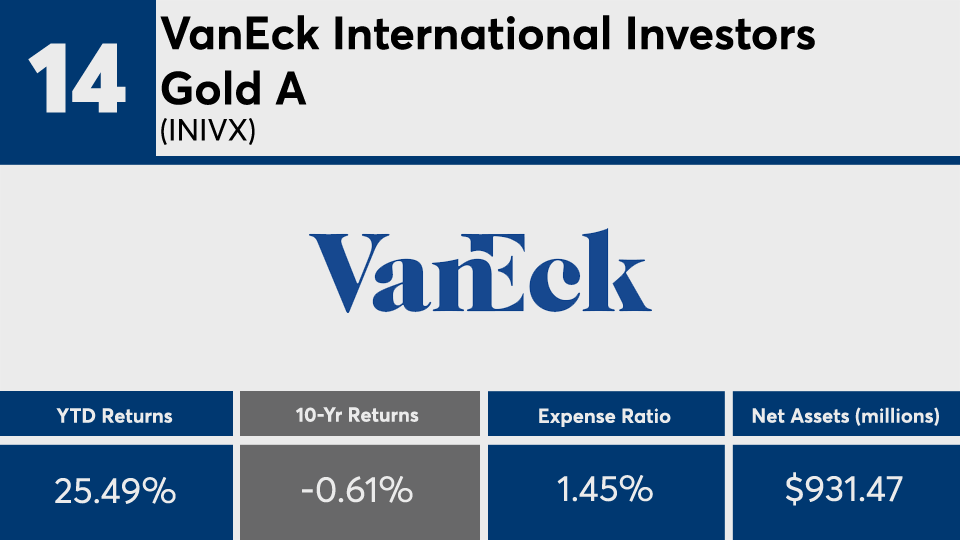
VanEck International Investors Gold A (INIVX)

1-Yr. Return: 73.21%
3-Yr. Annualized Return: 14.00%
5-Yr. Annualized Return: 12.36%
Load: 5.75%
FP052120_13 copy.png

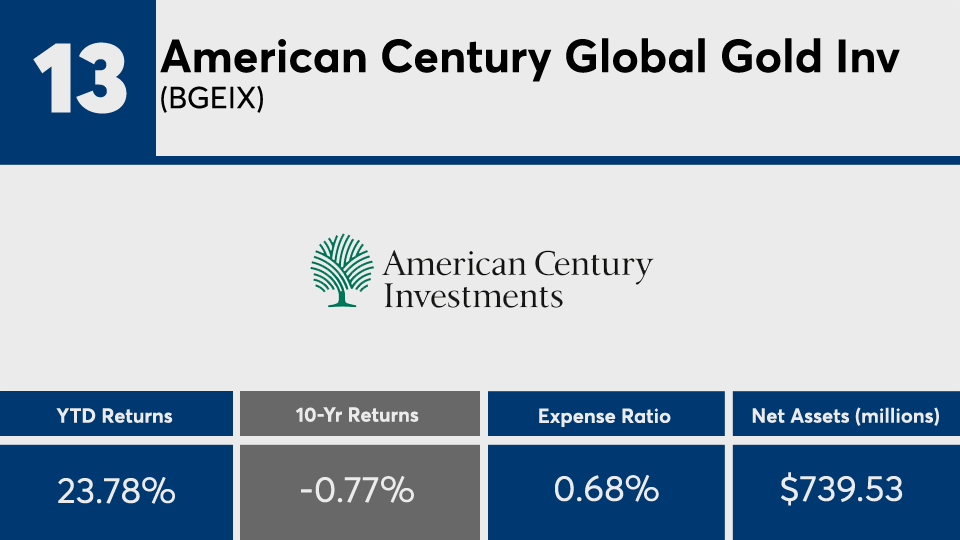
American Century Global Gold Inv (BGEIX)

1-Yr. Return: 73.84%
3-Yr. Annualized Return: 17.50%
5-Yr. Annualized Return: 13.86%
FP052120_12 copy.png

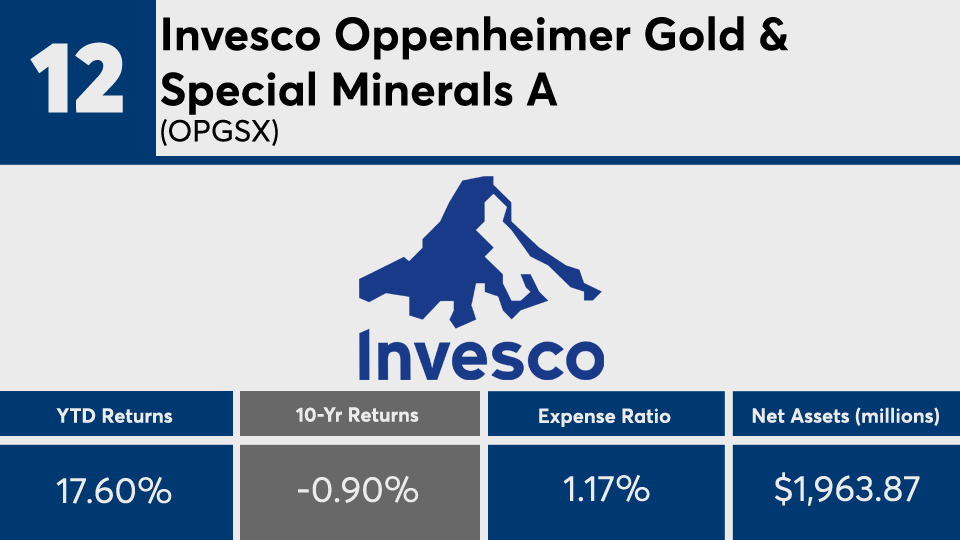
Invesco Oppenheimer Gold & Special Minerals A (OPGSX)

1-Yr. Return: 65.44%
3-Yr. Annualized Return: 16.27%
5-Yr. Annualized Return: 14.12%
Load: 5.50%
FP052120_11 copy.png

Vanguard Energy Admiral (VGELX)

1-Yr. Return: -31.92%
3-Yr. Annualized Return: -11.41%
5-Yr. Annualized Return: -7.85%
FP052120_10 copy.png

Invesco Opp SteelPath MLP Alpha Y (MLPOX)

1-Yr. Return:
3-Yr. Annualized Return:
5-Yr. Annualized Return:
FP052120_9 copy.png

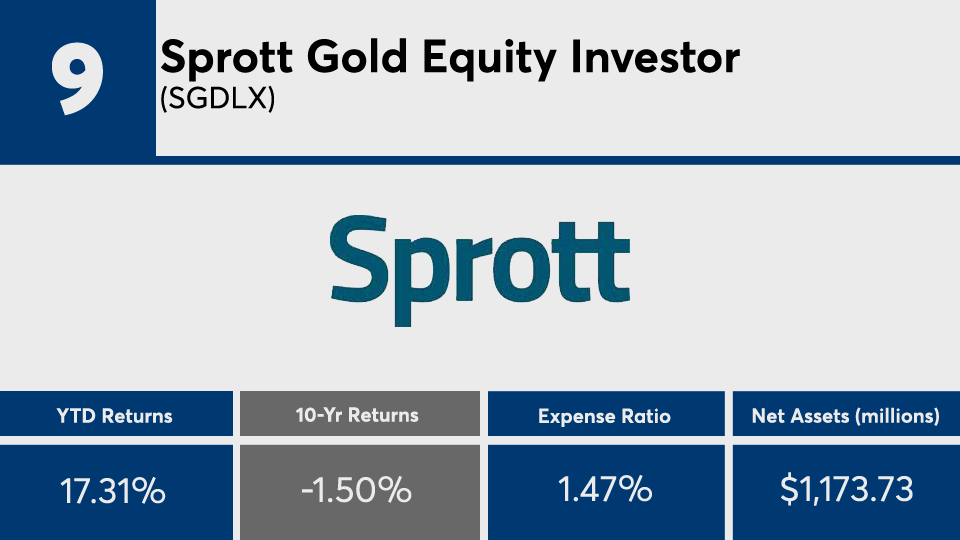
Sprott Gold Equity Investor (SGDLX)

1-Yr. Return: 61.91%
3-Yr. Annualized Return: 9.81%
5-Yr. Annualized Return: 8.18%
FP052120_8 copy.png

Fidelity Select Gold (FSAGX)

1-Yr. Return: 71.05%
3-Yr. Annualized Return: 14.32%
5-Yr. Annualized Return: 12.54%
FP052120_7 copy.png

USAA Precious Metals and Minerals (USAGX)

1-Yr. Return: 74.07%
3-Yr. Annualized Return: 15.98%
5-Yr. Annualized Return: 11.24%
FP052120_6 copy.png

Fidelity Select Energy (FSENX)

1-Yr. Return: 74.07%
3-Yr. Annualized Return: 15.98%
5-Yr. Annualized Return: 11.24%
FP052120_5 copy.png

Invesco Opp SteelPath MLP Income A (MLPDX)

1-Yr. Return: -38.96%
3-Yr. Annualized Return: -15.94%
5-Yr. Annualized Return: -13.05%
Load: 5.50%
FP052120_4 copy.png

Franklin Gold and Precious Metals A (FKRCX)

1-Yr. Return: 71.94%
3-Yr. Annualized Return: 9.20%
5-Yr. Annualized Return: 9.59%
Load: 5.50%
FP052120_3 copy.png

Credit Suisse Commodity Return Strategy I (CRSOX)

1-Yr. Return: -17.89%
3-Yr. Annualized Return: -7.37%
5-Yr. Annualized Return: -7.82%
FP052120_2 copy.png

Vanguard Global Capital Cycles Investor (VGPMX)

1-Yr. Return: -0.52%
3-Yr. Annualized Return: -9.55%
5-Yr. Annualized Return: -4.26%
FP052120_1 copy.png

Fidelity Series Commodity Strategy (FCSSX)

1-Yr. Return: -19.11%
3-Yr. Annualized Return: -7.66%
5-Yr. Annualized Return: -8.47%
MORE FROM FINANCIAL PLANNING