The Dow Jones Industrial Average rallied up 46 points to close at 12.984.69 Thursday as investors took a shine to stocks in virtually all the major industries following a one-day sell-off.
The Nasdaq rose 23.81 points to finish at 2,956.98 and the S&P 500 moved up 5.80 points to end at 1,363.46.
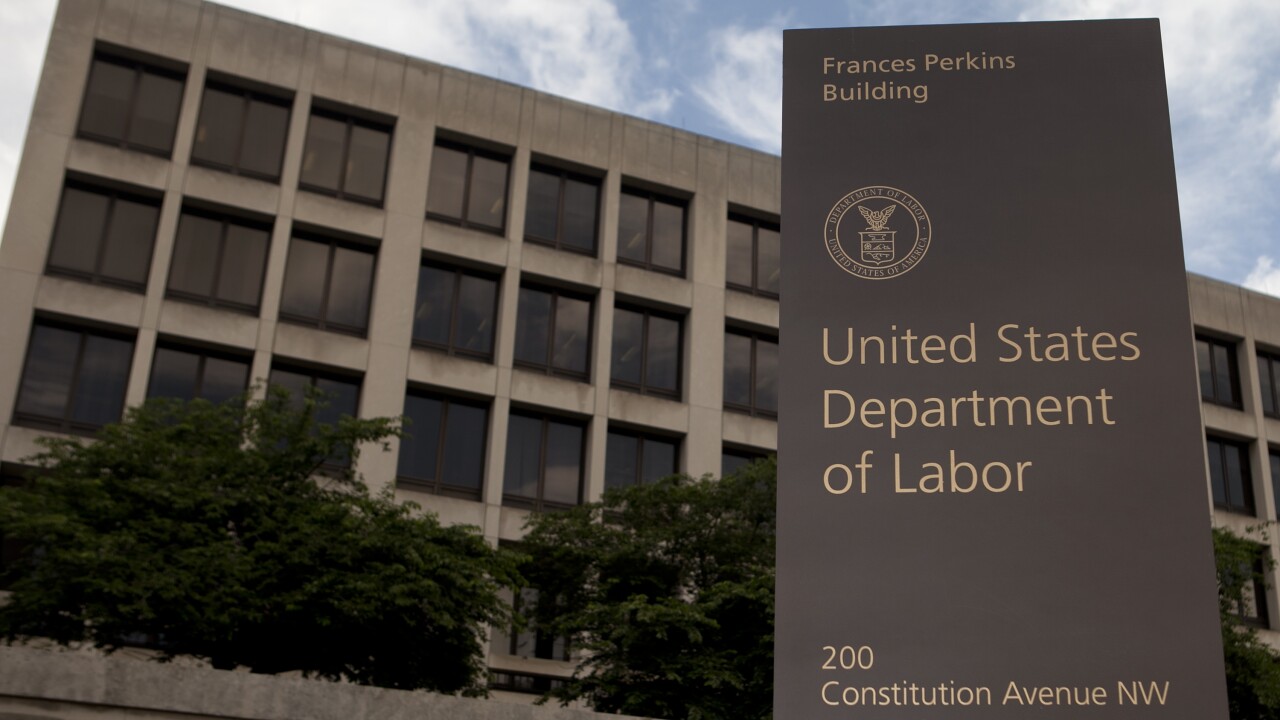
On the economic front, the Labor Department reported unemployment claims remained flat at 351,000 last week while the Federal Housing Finance Agency said home prices moved up 0.7% in December after rising 1.0% in November.
Nine out of the 10 key S&P industry sectors ended in positive territory.
Here are some more details from Thursday’s trading session:
Dow Jones Industrial Average:
- Up four of the past five trading days.
- A new 52-week high.
- Highest closing value since May 19, 2008.
- An intraday high of 12996.08 occurred at 11:15:24 today, representing an increase of 57.41 points, or 0.44%.
- An intraday low of 12882.67 occurred at 09:45:46 today, representing a decrease of 56.00 points, or 0.43%.
- Twenty of the 30 component stocks rose, 10 fell.
- Today's top five contributors to The Dow's movement and their point contribution: IBM (28.31), PG (14.99), CVX (6.43), JPM (3.18), CAT (2.95).
- Today's bottom five laggards: HPQ (-14.30), UTX (-3.48), PFE (-2.50), BA (-1.59), AXP (-0.91).
- Down 8.33% from its record close of 14164.53 on October 09, 2007.
- Up 98.33% from its 12-year closing low of 6547.05 on March 9, 2009.
- Up 7.59% from 52 weeks ago.
- Up 5.05% from its 2012 closing low of 12359.92 on January 06, 2012.
- Up 21.86% from its 52-week low of 10655.30 on October 03, 2011.
- Month-to-date: up 2.78%.
- Year-to-date: up 6.28%.
Dow Jones U.S. Total Stock Market Index:
- Dow Jones U.S. Total Stock Market Index, 14226.35*, up 78.80 points, or 0.56%, or $93.9 billion in market capitalization.
- First gain in three trading days.
- A new 2012 closing high.
- Highest closing value since May 10, 2011.
- Down 9.65%, (approximately 2.6 trillion in market cap), from its record close of 15745.39 on October 09, 2007.
- Up 109.21% (approximately $8.6 trillion in market cap), from the 12-½ year closing low of 6800.08 on March 9, 2009.
- Up 4.39% from 52 weeks ago.
- Up 7.72% from its 2012 closing low of 13206.64 on January 04, 2012.
- Down 0.57% from its 52-week high of 14308.37 on April 29, 2011.
- Up 25.91% from its 52-week low of 11299.07 on October 03, 2011.
- Month-to-date: up 4.12%, or $656 billion in market cap.
- Year-to-date: up 9.27% or $1.4 trillion in market cap.
Data courtesy of Dow Jones Indexes.


