
That dynamic could be seen in the expense data as well. The average on this week’s list was 70 basis points. That‘s not so high compared to historical norms, perhaps, but it's much more expensive than last week’s average of 8 basis points.
•
•
And to give the same context we offered for inflows: The $55 billion in outflows, if channeled into one revenue stream, would be enough to rank 53rd on the recently released Fortune 500, above Morgan Stanley and Goldman Sachs based on those firms’ revenue figures last year.
Scroll through to see the latest 20 outflows year to date. All data from Morningstar.
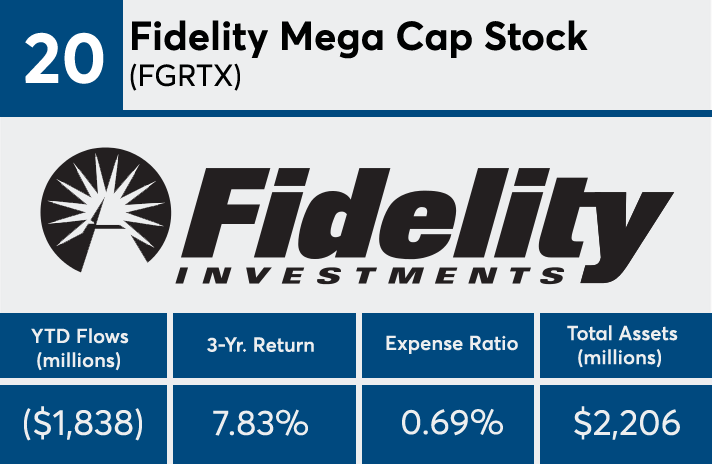
20. Fidelity Mega Cap Stock (FGRTX)
3-Yr. Return: 7.83%
Expense Ratio: 0.69%
Total Assets (millions): $2,205.71

19. Strategic Advisers International (FILFX)
3-Yr. Return: 2.30%
Expense Ratio: 0.76%
Total Assets (millions):
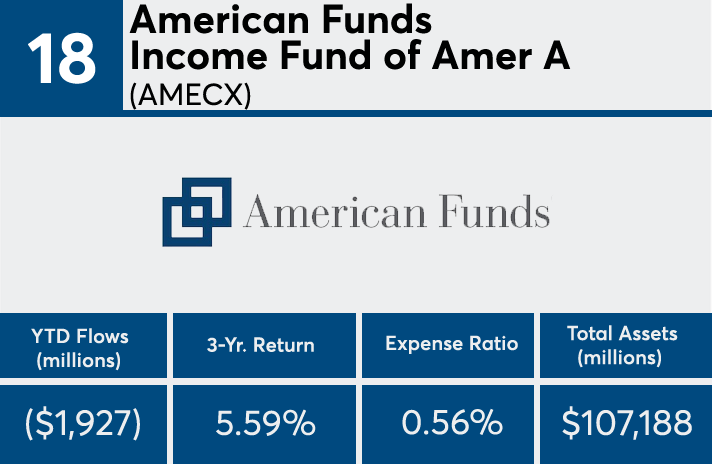
18. American Funds Income Fund of Amer A (AMECX)
3-Yr. Return: 5.59%
Expense Ratio: 0.56%
Total Assets (millions): $107,188.47

17. American Funds Washington Mutual A (AWSHX)
3-Yr. Return: 8.37%
Expense Ratio: 0.58%
Total Assets (millions): $92,448.99
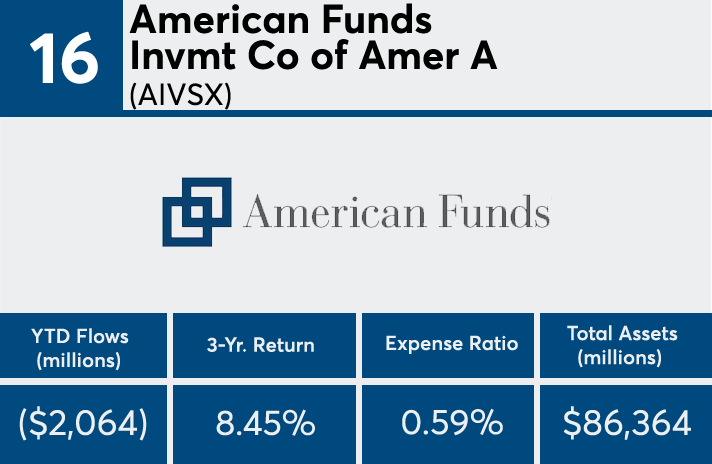
16. American Funds Invmt Co of Amer A (AIVSX)
3-Yr. Return: 8.45%
Expense Ratio: 0.59%
Total Assets (millions): $86,363.80

15. Fidelity Low-Priced Stock (FLPSX)
3-Yr. Return: 6.49%
Expense Ratio: 0.88%
Total Assets (millions): $38,363.84

14. Strategic Advisers Core (FCSAX)
3-Yr. Return: 8.87%
Expense Ratio: 0.56%
Total Assets (millions): $23,160.42

13. Multi-Manager Growth Strategies A (CSLGX)
3-Yr. Return: 10.22%
Expense Ratio: 1.12%
Total Assets (millions): $2,498.35
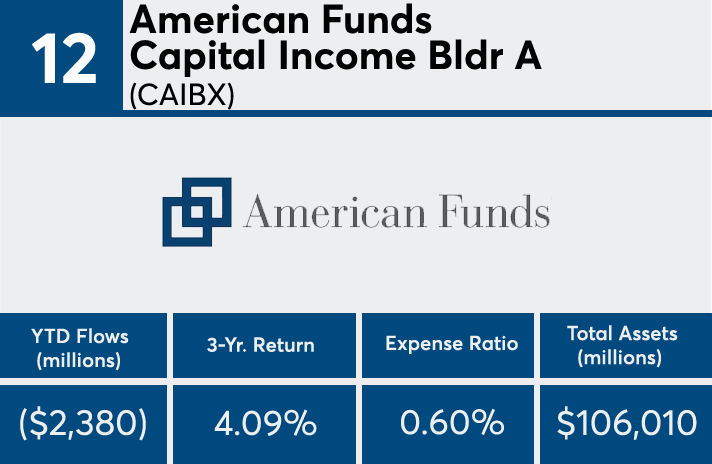
12. American Funds Capital Income Bldr A (CAIBX)
3-Yr. Return: 4.09%
Expense Ratio: 0.60%
Total Assets (millions): $106,010.01
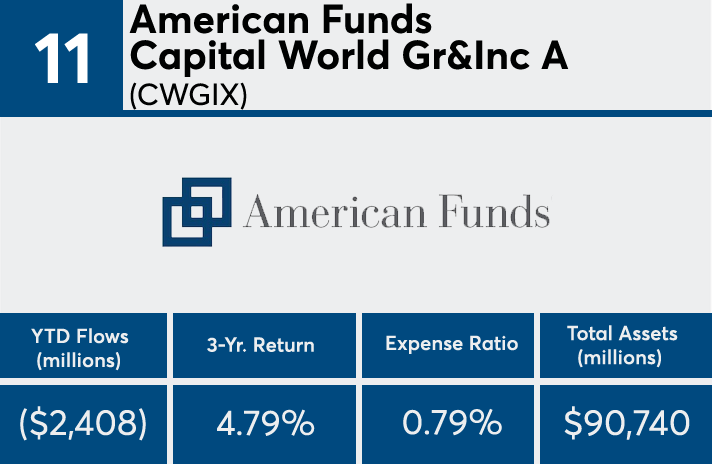
11. American Funds Capital World Gr&Inc A (CWGIX)
3-Yr. Return: 4.79%
Expense Ratio: 0.79%
Total Assets (millions): $90,740.05
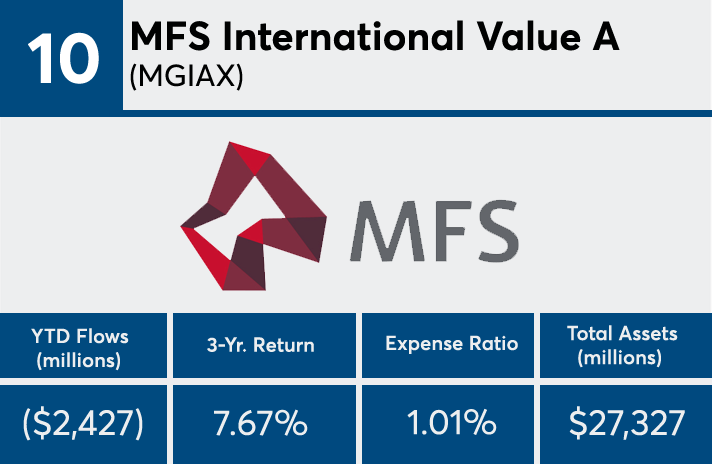
10. MFS International Value A (MGIAX)
3-Yr. Return: 7.67%
Expense Ratio: 1.01%
Total Assets (millions): $27,327.32
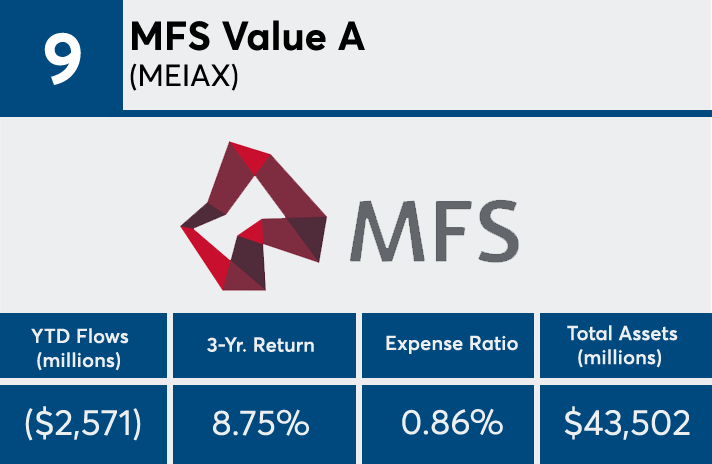
9. MFS Value A (MEIAX)
3-Yr. Return: 8.75%
Expense Ratio: 0.86%
Total Assets (millions): $43,501.81
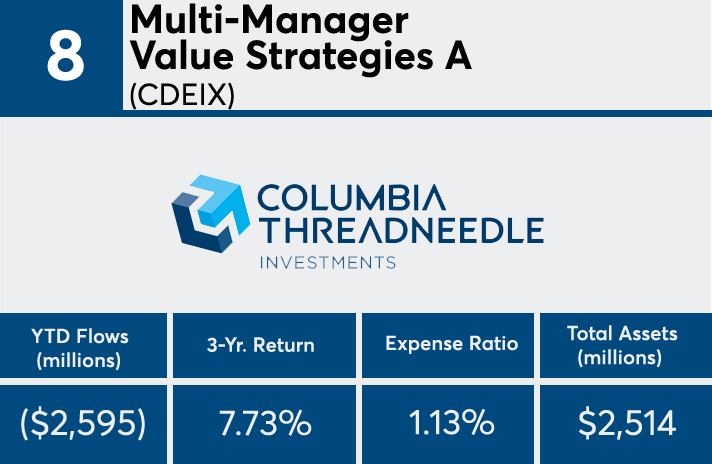
8. Multi-Manager Value Strategies A (CDEIX)
3-Yr. Return: 7.73%
Expense Ratio: 1.13%
Total Assets (millions): $2,513.77
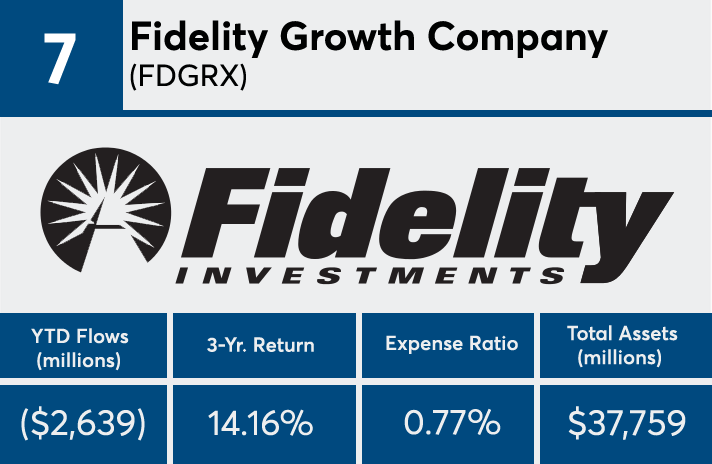
7. Fidelity Growth Company (FDGRX)
3-Yr. Return: 14.16%
Expense Ratio: 0.77%
Total Assets (millions): $37,758.80

6. American Funds Growth Fund of Amer A (AGTHX)
3-Yr. Return: 10.32%
Expense Ratio: 0.66%
Total Assets (millions): $163,478.14

5. T. Rowe Price Growth Stock (PRGFX)
3-Yr. Return: 12.94%
Expense Ratio: 0.68%
Total Assets (millions): $50,712.37

4. Fidelity Contrafund (FCNTX)
3-Yr. Return: 11.07%
Expense Ratio: 0.68%
Total Assets (millions): $114,455.36

3. iShares Russell 2000 (IWM)
3-Yr. Return: 8.12%
Expense Ratio: 0.20%
Total Assets (millions): $37,396.24
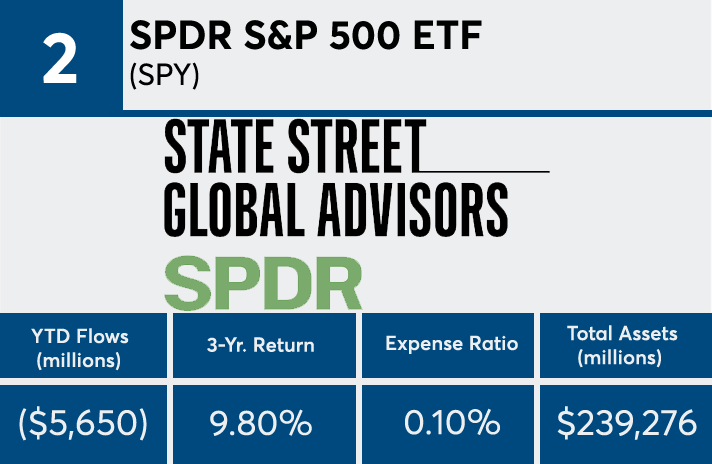
2. SPDR S&P 500 ETF (SPY)
3-Yr. Return: 9.80%
Expense Ratio: 0.10%
Total Assets (millions): $239,276.05
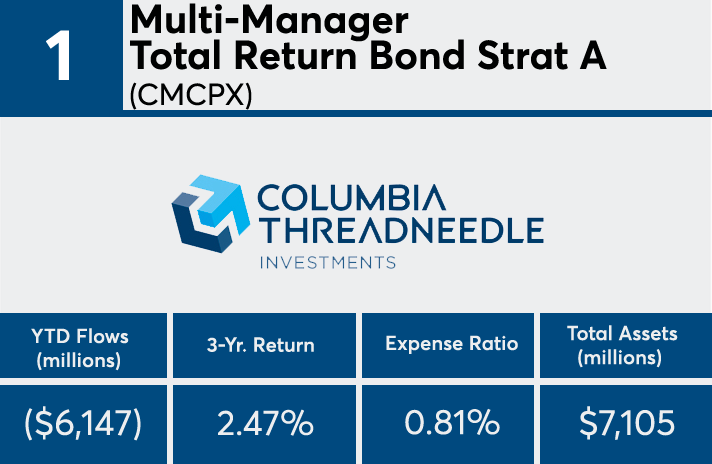
1. Multi-Manager Total Return Bond Strat A (CMCPX)
3-Yr. Return: 2.47%
Expense Ratio: 0.81%
Total Assets (millions): $7,104.79


