
Indeed, since the election in November, the S&P 500 has surged 11.4%. And if clients were prescient enough to buy the index in June, they would be looking at an 18% gain.
But has the pendulum swung too far? To be sure, P/E ratios have surged even higher, but using history as a guide, equity prices have gotten ahead of corporate earnings. The S&P 500 P/E stands at 24.9; the historical average from 1960 is 16.8.
Bloomberg points out another way of looking at it: Compared to cash balances, the value of global equities is the
Whether you and your clients are still bullish on equities or want to take some profits, scroll through to see the top 20 mutual funds by P/E ratios. All data from Morningstar.
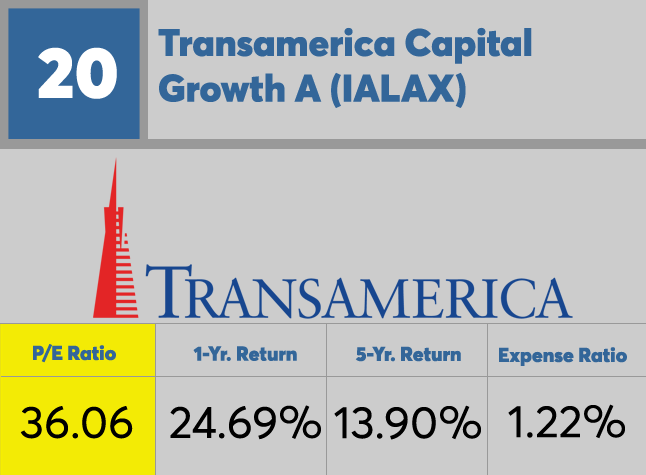
20. Transamerica Capital Growth A (IALAX)
1-Yr. Return: 24.69%
5-Yr. Return: 13.90%
Expense Ratio: 1.22%
Net Assets (millions): $673.60
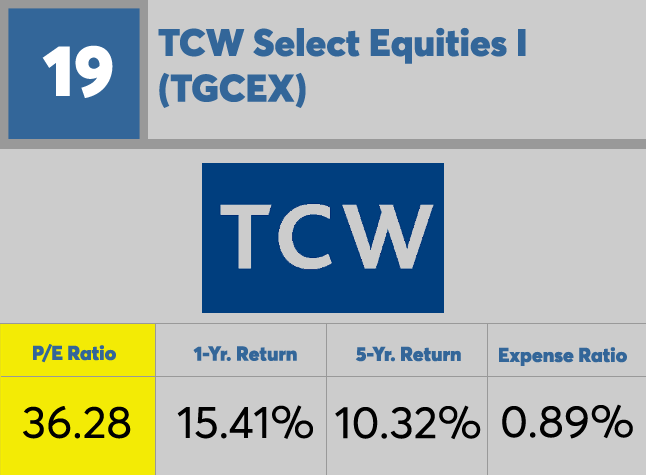
19. TCW Select Equities I (TGCEX)
1-Yr. Return: 15.41%
5-Yr. Return: 10.32%
Expense Ratio: 0.89%
Net Assets (millions): $911.17
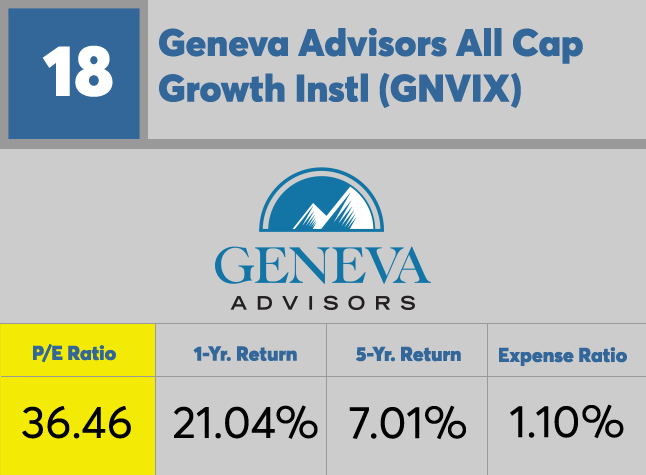
18. Geneva Advisors All Cap Growth Instl (GNVIX)
1-Yr. Return: 21.04%
5-Yr. Return: 7.01%
Expense Ratio: 1.10%
Net Assets (millions): $134.02
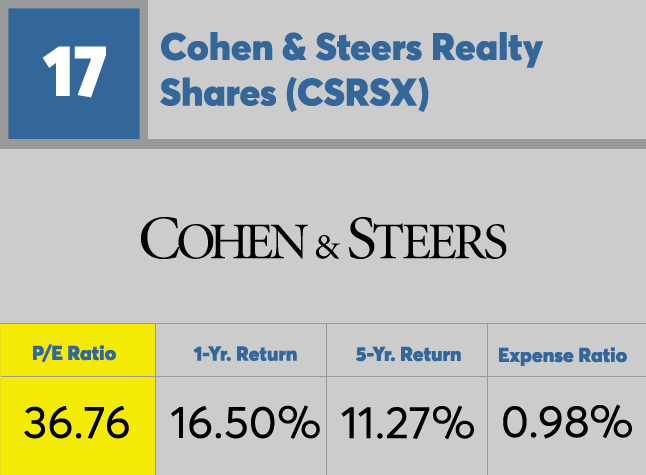
17. Cohen & Steers Realty Shares (CSRSX)
1-Yr. Return: 16.50%
5-Yr. Return: 11.27%
Expense Ratio: 0.98%
Net Assets (millions): $5,230.42
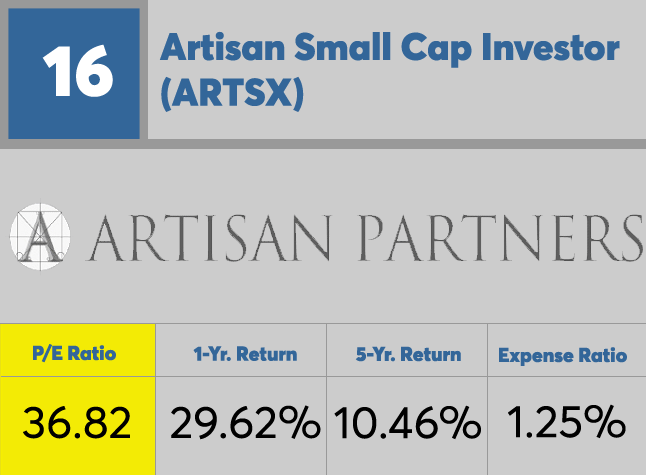
16. Artisan Small Cap Investor (ARTSX)
1-Yr. Return: 29.62%
5-Yr. Return: 10.46%
Expense Ratio: 1.25%
Net Assets (millions): $1,218.97
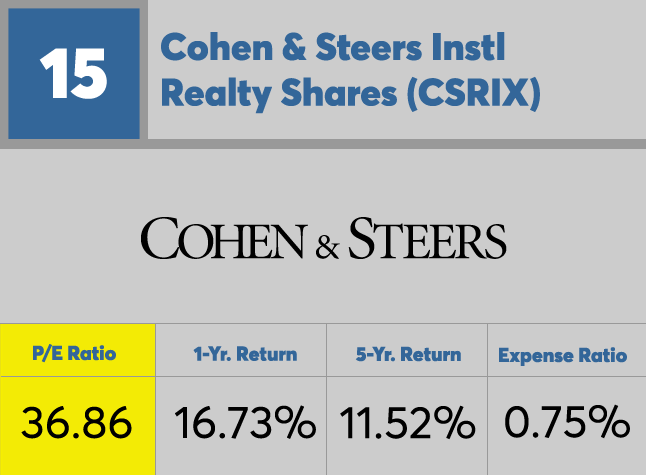
15. Cohen & Steers Instl Realty Shares (CSRIX)
1-Yr. Return: 16.73%
5-Yr. Return: 11.52%
Expense Ratio: 0.75%
Net Assets (millions): $2,763.52
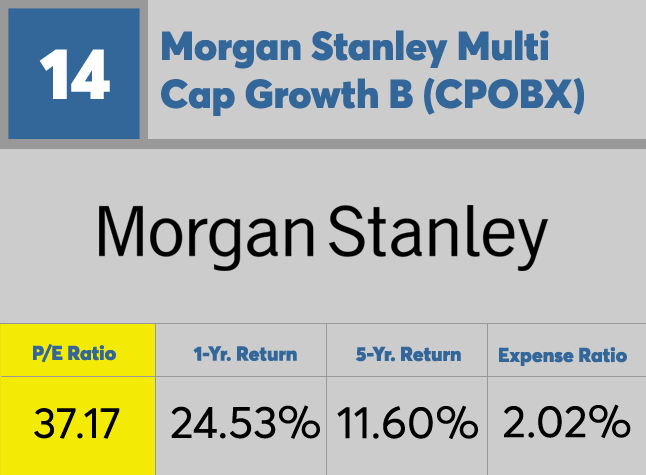
14. Morgan Stanley Multi Cap Growth B (CPOBX)
1-Yr. Return: 24.53%
5-Yr. Return: 11.60%
Expense Ratio: 2.02%
Net Assets (millions): $332.33
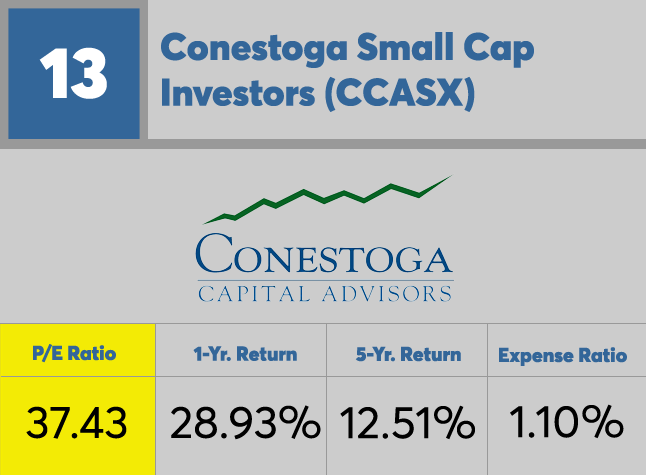
13. Conestoga Small Cap Investors (CCASX)
1-Yr. Return: 28.93%
5-Yr. Return: 12.51%
Expense Ratio: 1.10%
Net Assets (millions): $961.34
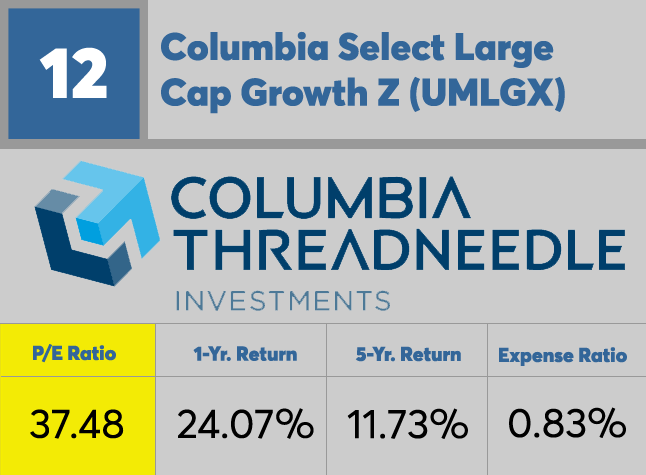
12. Columbia Select Large Cap Growth Z (UMLGX)
1-Yr. Return: 24.07%
5-Yr. Return: 11.73%
Expense Ratio: 0.83%
Net Assets (millions): $4,603.89
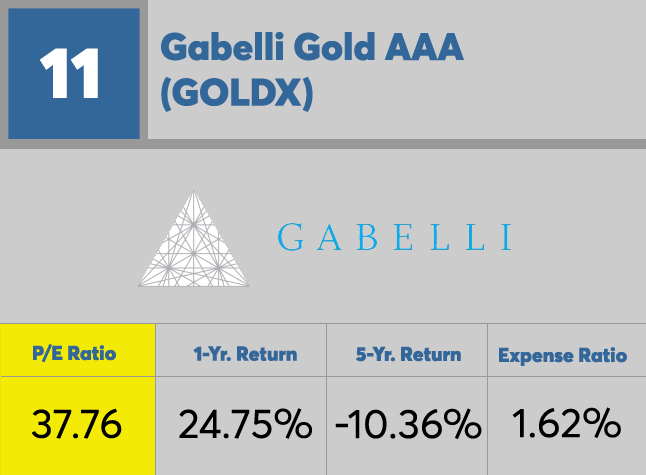
11. Gabelli Gold AAA (GOLDX)
1-Yr. Return: 24.75%
5-Yr. Return: -10.36%
Expense Ratio: 1.62%
Net Assets (millions): $317.22
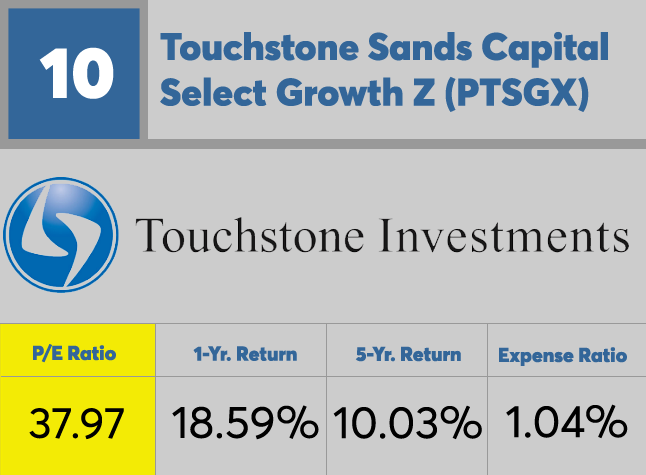
10. Touchstone Sands Capital Select Growth Z (PTSGX)
1-Yr. Return: 18.59%
5-Yr. Return: 10.03%
Expense Ratio: 1.04%
Net Assets (millions): $2,566.87
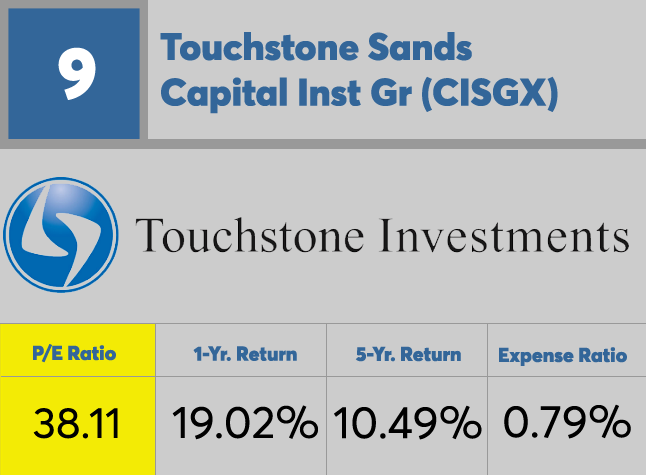
9. Touchstone Sands Capital Inst Gr (CISGX)
1-Yr. Return: 19.02%
5-Yr. Return: 10.49%
Expense Ratio: 0.79%
Net Assets (millions): $2,264.80%
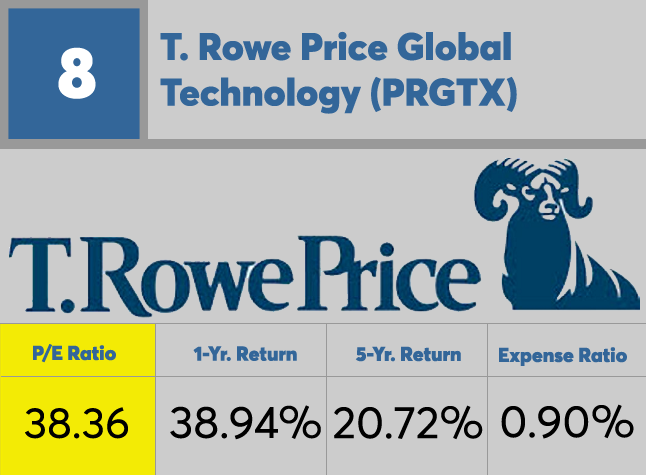
8. T. Rowe Price Global Technology (PRGTX)
1-Yr. Return: 38.94%
5-Yr. Return: 20.72%
Expense Ratio: 0.90%
Net Assets (millions): $3,552.57
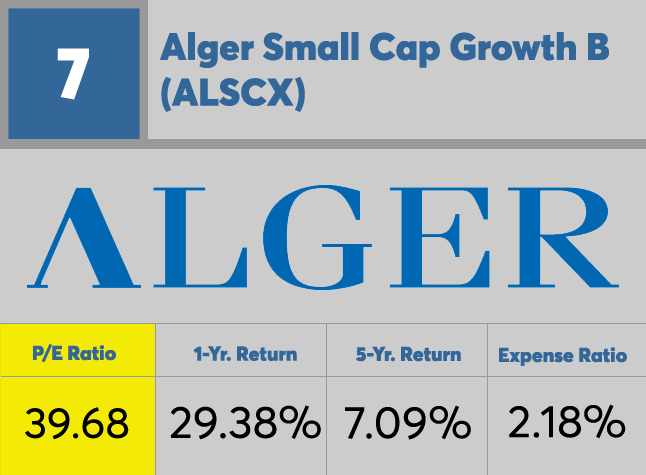
7. Alger Small Cap Growth B (ALSCX)
1-Yr. Return: 29.38%
5-Yr. Return: 7.09%
Expense Ratio: 2.18%
Net Assets (millions): $130.44
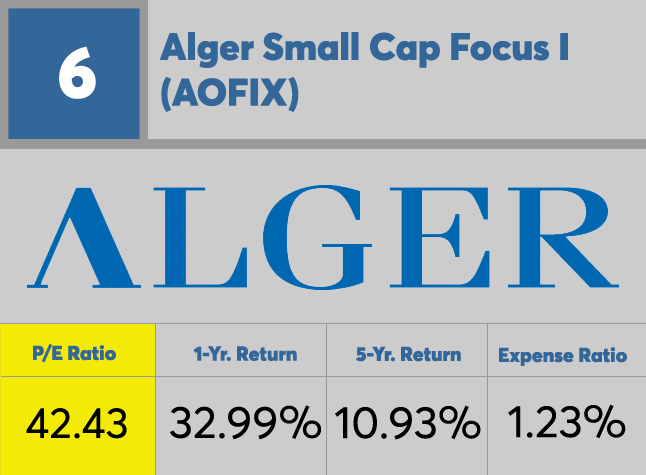
6. Alger Small Cap Focus I (AOFIX)
1-Yr. Return: 32.99%
5-Yr. Return: 10.93%
Expense Ratio: 1.23%
Net Assets (millions): $300.36
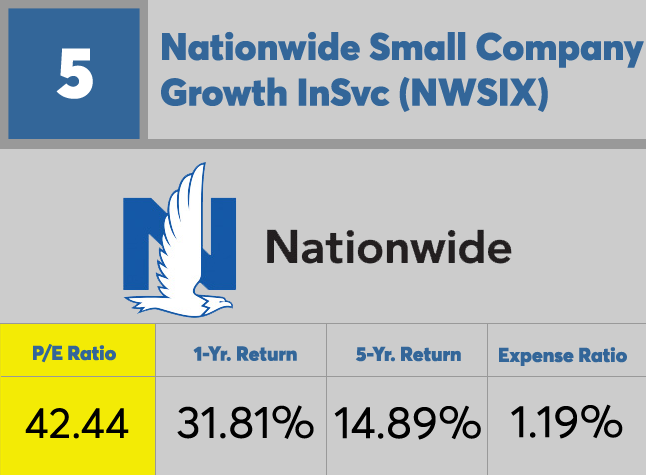
5. Nationwide Small Company Growth InSvc (NWSIX)
1-Yr. Return: 31.81%
5-Yr. Return: 14.89%
Expense Ratio: 1.19%
Net Assets (millions): $194.17
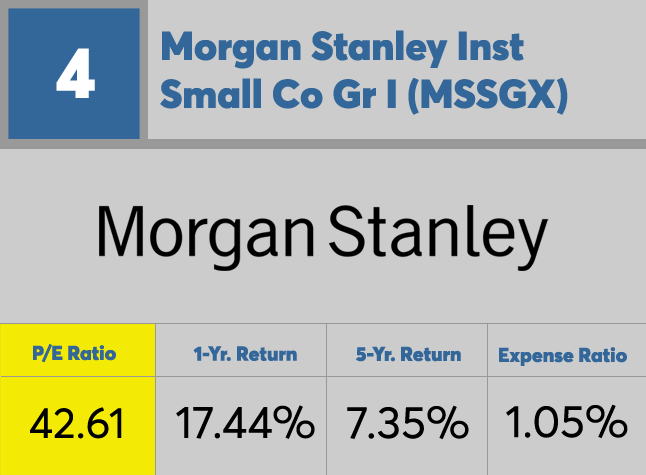
4. Morgan Stanley Inst Small Co Gr I (MSSGX)
1-Yr. Return: 17.44%
5-Yr. Return: 7.35%
Expense Ratio: 1.05%
Net Assets (millions): $517.84
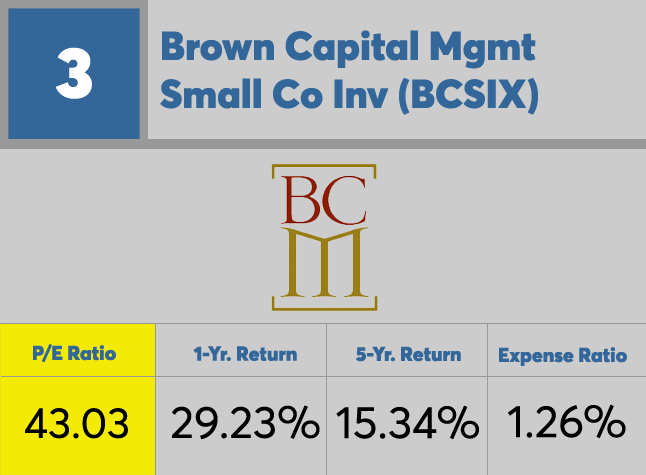
3. Brown Capital Mgmt Small Co Inv (BCSIX)
1-Yr. Return: 29.23%
5-Yr. Return: 15.34%
Expense Ratio: 1.26%
Net Assets (millions): $3,586.72
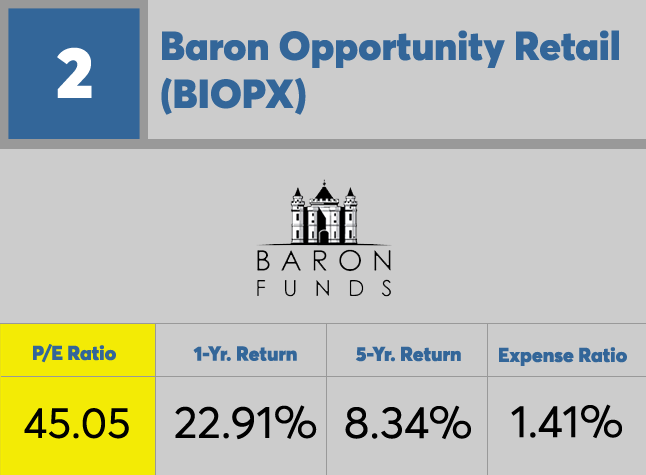
2. Baron Opportunity Retail (BIOPX)
1-Yr. Return: 22.91%
5-Yr. Return: 8.34%
Expense Ratio: 1.41%
Net Assets (millions): $218.43
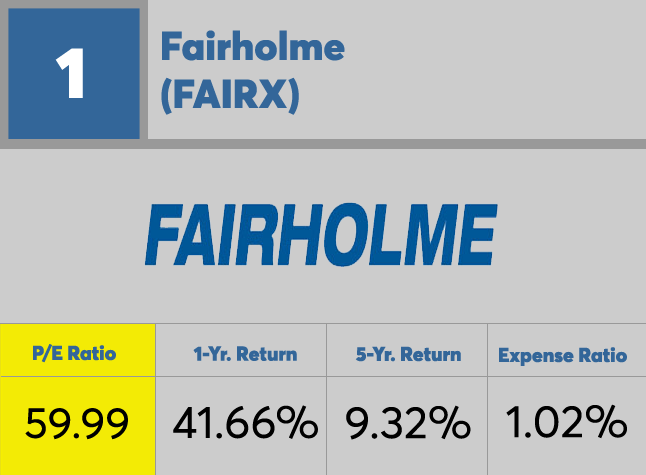
1. Fairholme (FAIRX)
1-Yr. Return: 41.66%
5-Yr. Return: 9.32%
Expense Ratio: 1.02%
Net Assets (millions): $2,701.44


