In the markets, two gauges have plunged in recent weeks: the PowerShares QQQ fell more than 5% in the past 30 days, while Vanguard's tech ETF (VGT) fell 4.4%.
The big names in the sector — media and Wall Street darlings for years — have received most of the attention lately. Facebook has plummeted 11% in the past month after users learned sensitive user data was improperly used, spooking investors and drawing the ire of Congress. (It was announced that Facebook CEO Mark Zuckerberg would testify in front of Congress on April 11.) Meanwhile, Amazon fell 5% in the past month while getting slammed by President Trump on a number of issues such as not paying enough taxes.
To be sure, these declines have been the anomaly for the high-flying tech sector. Over the past year, the QQQ has gained 19.9%; the Vanguard ETF, 25.8%. As for those individual stocks over that time period, Amazon gained 56%, and Facebook 9.7%. Over the past three years, it’s been just as impressive with annualized gains of 15.5% for the QQQ, and 18.4% for the VGT.
Indeed, growth stocks can become a victim of their own success when investors’ expectations get too high, notes Greg McBride, chief financial analyst at financial website Bankrate. “What brings tech back to earth isn’t that [earnings] stop growing," he notes. Rather, they just don’t grow as fast as they had been expected to grow, he said in an email.
Still, others caution to not shrug off the recent declines as a momentary blip. Over the next five to 10 years, Christine Benz, director of personal finance at Morningstar, says she would not be surprised to see more muted performance in the sector simply because it has historically followed periods of very strong returns with “epic downturns.” The fact that “technology stocks have led the market's advance — and that the rally has entered its ninth year — should give anyone pause about committing large amounts to the sector at this point,” she said in an email.
She notes that Morningstar analysts have pegged their price/fair value for companies in the tech sector at .98. (If all the companies in the group were trading in line with fair value, that number would be 1.0, she says.)
That doesn't mean the analysts feel the sector is egregiously overvalued, but “nor is it a screaming buy.”
In the sector's favor is the ability of certain companies to grow organically instead of being dependent on economy, Benz says. Also, she notes that despite the concerns about the largest companies, it's important to remember just how broad and encompassing the sector is and how many different types of companies reside there. “Facebook's issues won't have a meaningful impact on anyone's decision about whether to upgrade to iPhone X.”
Scroll through to see the top performing tech funds over the past three years. We also included one-year returns and expense ratios for each fund. The only fund here with a front load, as noted in the slides, is Victory RS Science and Technology A, with a 5.75% charge. All data from Morningstar Direct.

20. iShares North American Tech ETF (IGM)
3-Yr. Return: 20.98%
Expense Ratio: 0.48%
Total Assets (millions): $1,480.45

19. Berkshire Focus (BFOCX)
3-Yr. Return: 21.04%
Expense Ratio: 2.02%
Total Assets (millions): $115.52

18. iShares North American Tech-Software ETF (IGV)
3-Yr. Return: 21.20%
Expense Ratio: 0.48%
Total Assets (millions): $1,406.69

17. First Trust NASDAQ-100-Tech Sector ETF (QTEC)
3-Yr. Return: 21.64%
Expense Ratio: 0.60%
Total Assets (millions): $2,427.62

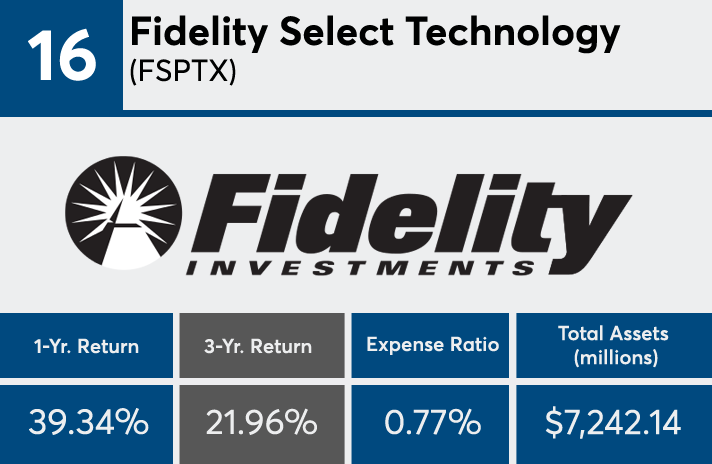
16. Fidelity Select Technology (FSPTX)
3-Yr. Return: 21.96%
Expense Ratio: 0.77%
Total Assets (millions): $7,242.14

15. Fidelity Advisor Technology I (FATIX)
3-Yr. Return: 22.08%
Expense Ratio: 0.77%
Total Assets (millions): $1,985.51

14. SPDR NYSE Technology ETF (XNTK)
3-Yr. Return: 22.14%
Expense Ratio: 0.35%
Total Assets (millions): $942.32

13. Victory RS Science and Technology A (RSIFX)
3-Yr. Return: 22.28%
Expense Ratio: 1.49%
Total Assets (millions): $222.58
Front Load: 5.75%

12. Fidelity Select Semiconductors (FSELX)
3-Yr. Return: 22.55%
Expense Ratio: 0.77%
Total Assets (millions): $3,653.20

11. Fidelity Advisor Semiconductors I (FELIX)
3-Yr. Return: 22.59%
Expense Ratio: 0.88%
Total Assets (millions): $295.35

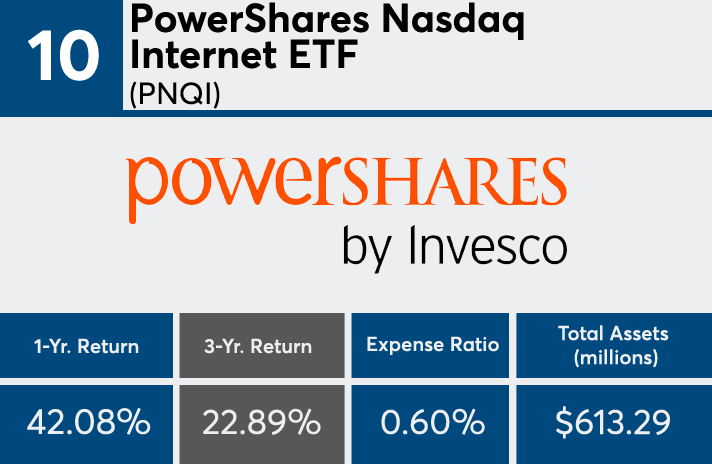
10. PowerShares Nasdaq Internet ETF (PNQI)
3-Yr. Return: 22.89%
Expense Ratio: 0.60%
Total Assets (millions): $613.29

9. First Trust Dow Jones Internet ETF (FDN)
3-Yr. Return: 23.33%
Expense Ratio: 0.54%
Total Assets (millions): $6,977.17

8. Global X Social Media ETF (SOCL)
3-Yr. Return: 24.09%
Expense Ratio: 0.65%
Total Assets (millions): $227.67

7. T. Rowe Price Global Technology (PRGTX)
3-Yr. Return: 24.29%
Expense Ratio: 0.90%
Total Assets (millions): $6,931.65

6. Putnam Global Technology Y (PGTYX)
3-Yr. Return: 24.48%
Expense Ratio: 1.03%
Total Assets (millions): $300.61

5. iShares PHLX Semiconductor ETF (SOXX)
3-Yr. Return: 24.84%
Expense Ratio: 0.48%
Total Assets (millions): $1,688.51

4. VanEck Vectors Semiconductor ETF (SMH)
3-Yr. Return: 24.87%
Expense Ratio: 0.35%
Total Assets (millions): $1,341.47

3. PowerShares Dynamic Semiconductors ETF (PSI)
3-Yr. Return: 25.39%
Expense Ratio: 0.63%
Total Assets (millions): $365.30

2. ARK Innovation ETF (ARKK)
3-Yr. Return: 26.33%
Expense Ratio: 0.75%
Total Assets (millions): $737.39

1. ARK Web x.0 ETF (ARKW)
3-Yr. Return: 34.63%
Expense Ratio: 0.75%
Total Assets (millions): $494.98


