
Two out of three are right. Yes, prices have soared. Since the election in November, the S&P 500 has surged 11.5%. Since June, 18.8%.
And
Bloomberg points out a similar measure of valuation. The CAPE ratio (cyclically adjusted price-to-earnings) calculated by Yale professor Robert Shiller is at heights seen just three times since 1881, the first year it’s available. The other two occasions were just before the 1929 crash and the dot-com crash in 2000.
But nothing left to buy? Maybe not. Some funds still have low P/E ratios, and if reversion-to-the-mean means anything, these funds could represent buying opportunities. Although there are no guarantees in the markets; sometimes prices decline and never come back. Or, as in the case of 1929, can take an entire generation to erase the losses.
Whether you and your clients are growing skittish about equities, or see a buying opportunity, scroll through to see the 20 mutual funds with the lowest P/E ratios. All data from Morningstar.

20. Causeway Emerging Markets Instl (CEMIX)
1-Yr. Return: 30.68%
3-Yr. Return: 1.94%
Expense Ratio: 1.18%
Net Assets (millions): $3,347.83

19. GMO Emerging Markets III (GMOEX)
1-Yr. Return: 34.67%
3-Yr. Return: 2.28%
Expense Ratio: 1.04%
Net Assets (millions): $5,017.15

18. Brandes Emerging Markets Value I (BEMIX)
1-Yr. Return: 37.77%
3-Yr. Return: 0.98%
Expense Ratio: 1.12%
Net Assets (millions): $1,414.31

17. Cohen & Steers International Realty I (IRFIX)
1-Yr. Return: 9.40%
3-Yr. Return: 2.26%
Expense Ratio: 0.99%
Net Assets (millions): $606.44

16. Towle Deep Value (TDVFX)
1-Yr. Return: 70.35%
3-Yr. Return: 11.76%
Expense Ratio: 1.20%
Net Assets (millions): $168.89

15. PIMCO RAE Fundamental EMkts Instl (PEIFX)
1-Yr. Return: 52.92%
3-Yr. Return: 5.92%
Expense Ratio: 0.76%
Net Assets (millions): $1,393

14. Miller Opportunity C (LMOPX)
1-Yr. Return: 30.38%
3-Yr. Return: 4.40%
Expense Ratio: 2.09%
Net Assets (millions): $1,351.70

13. Natixis Oakmark International A (NOIAX)
1-Yr. Return: 26.95%
3-Yr. Return: 0.04%
Expense Ratio: 1.34%
Net Assets (millions): $834.24
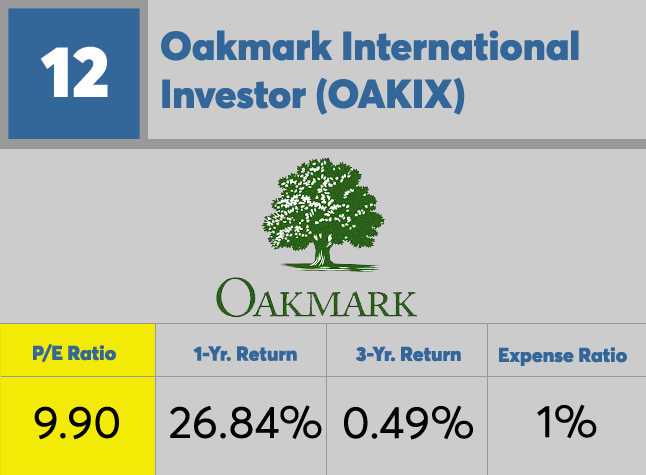
12. Oakmark International Investor (OAKIX)
1-Yr. Return: 26.84%
3-Yr. Return: 0.49%
Expense Ratio: 1%
Net Assets (millions): $28,714.04
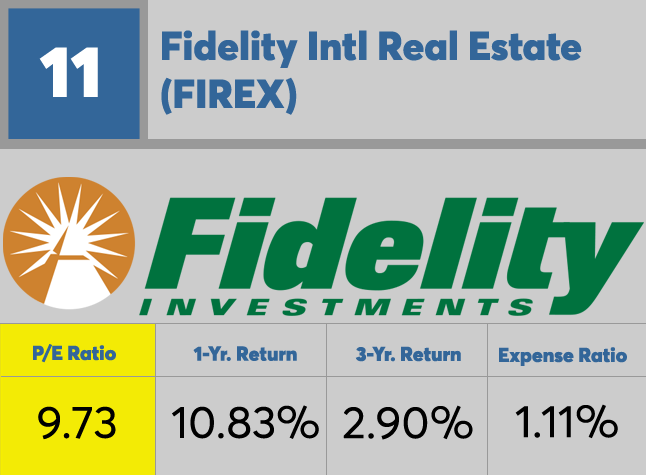
11. Fidelity Intl Real Estate (FIREX)
1-Yr. Return: 10.83%
3-Yr. Return: 2.90%
Expense Ratio: 1.11%
Net Assets (millions): $379.08
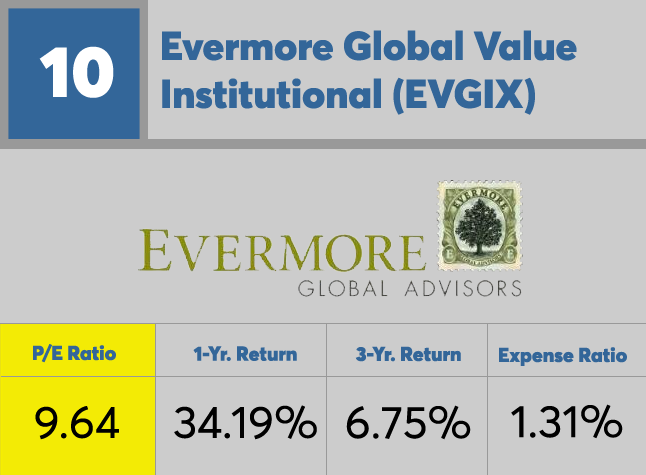
10. Evermore Global Value Institutional (EVGIX)
1-Yr. Return: 34.19%
3-Yr. Return: 6.75%
Expense Ratio: 1.31%
Net Assets (millions): $432.39

9. Templeton Frontier Markets Adv (FFRZX)
1-Yr. Return: 14.40%
3-Yr. Return: -9.89%
Expense Ratio: 1.90%
Net Assets (millions): $125.84
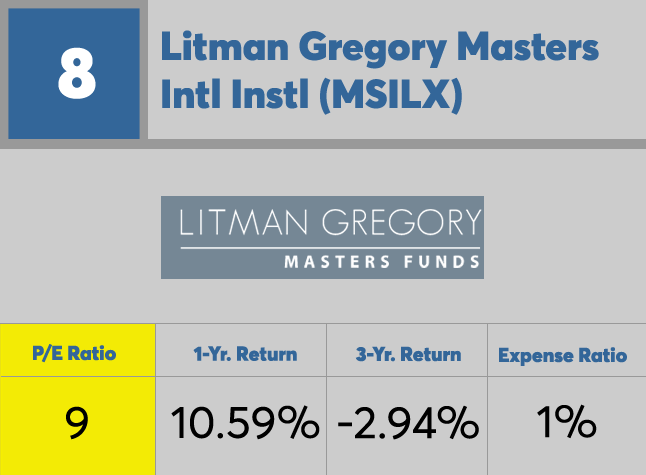
8. Litman Gregory Masters Intl Instl (MSILX)
1-Yr. Return: 10.59%
3-Yr. Return: -2.94%
Expense Ratio: 1%
Net Assets (millions): $661.46

7. Oakmark Global Select Investor (OAKWX)
1-Yr. Return: 29.75%
3-Yr. Return: 6.23%
Expense Ratio: 1.15%
Net Assets (millions): $2,356.77

6. Bridgeway Ultra-Small Company (BRUSX)
1-Yr. Return: 24.16%
3-Yr. Return: -3.23%
Expense Ratio: 1.17%
Net Assets (millions): $102.61
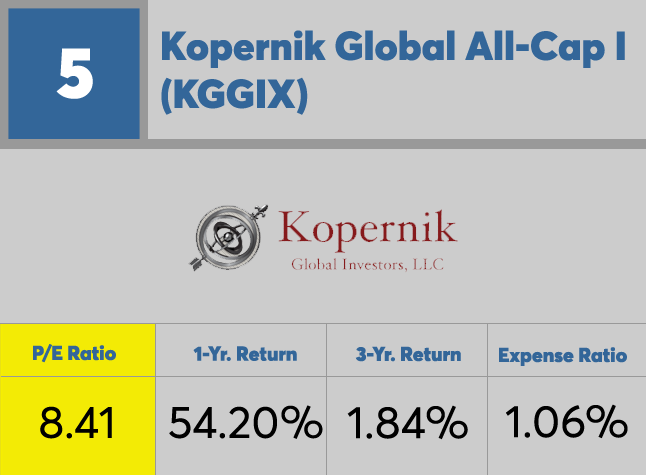
5. Kopernik Global All-Cap I (KGGIX)
1-Yr. Return: 54.20%
3-Yr. Return: 1.84%
Expense Ratio: 1.06%
Net Assets (millions): $1,052.95
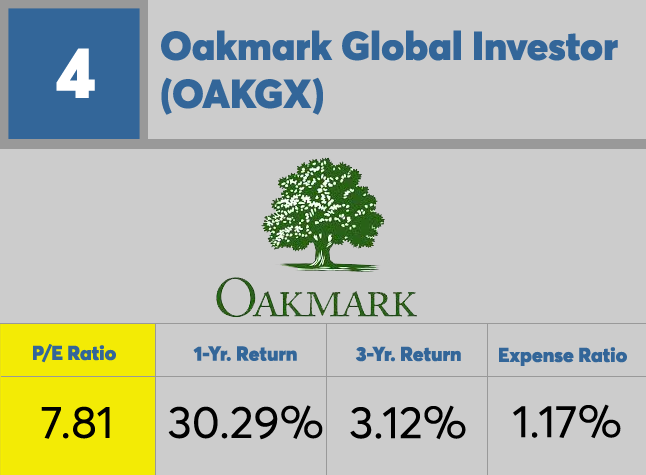
4. Oakmark Global Investor (OAKGX)
1-Yr. Return: 30.29%
3-Yr. Return: 3.12%
Expense Ratio: 1.17%
Net Assets (millions): $2,624.70
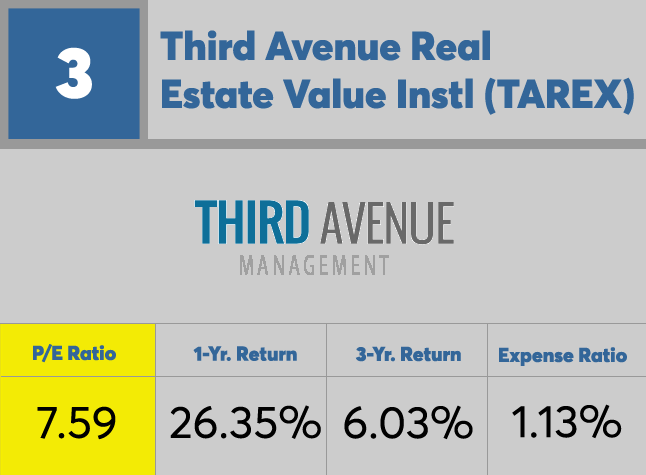
3. Third Avenue Real Estate Value Instl (TAREX)
1-Yr. Return: 26.35%
3-Yr. Return: 6.03%
Expense Ratio: 1.13%
Net Assets (millions): $1,815.45
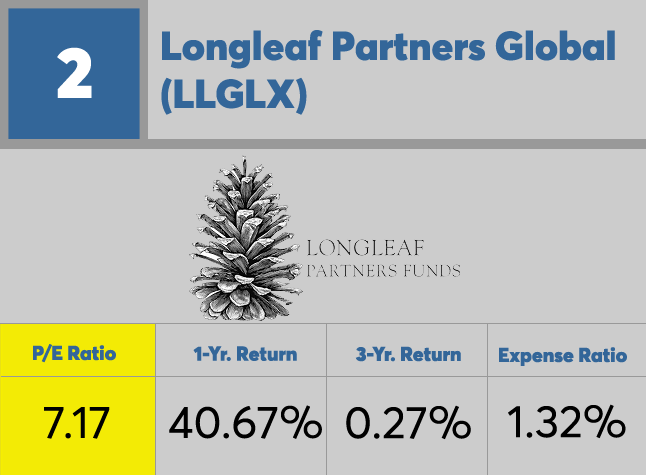
2. Longleaf Partners Global (LLGLX)
1-Yr. Return: 40.67%
3-Yr. Return: 0.27%
Expense Ratio: 1.32%
Net Assets (millions): $193.83

1. Longleaf Partners International (LLINX)
1-Yr. Return: 31.26%
3-Yr. Return: -3.05%
Expense Ratio: 1.33%
Net Assets (millions): $1,045.83


