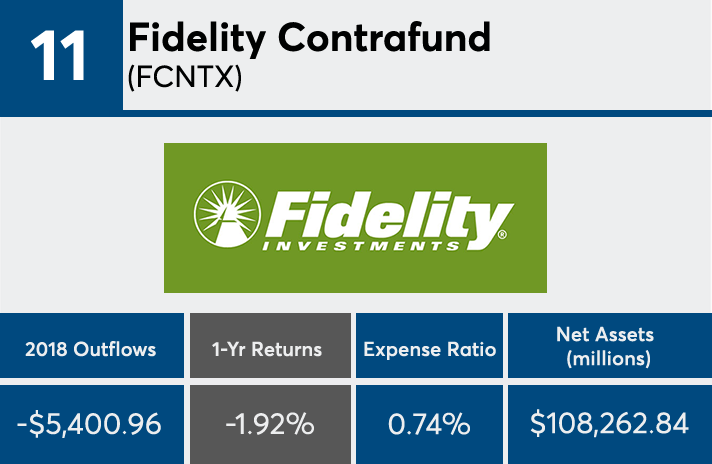
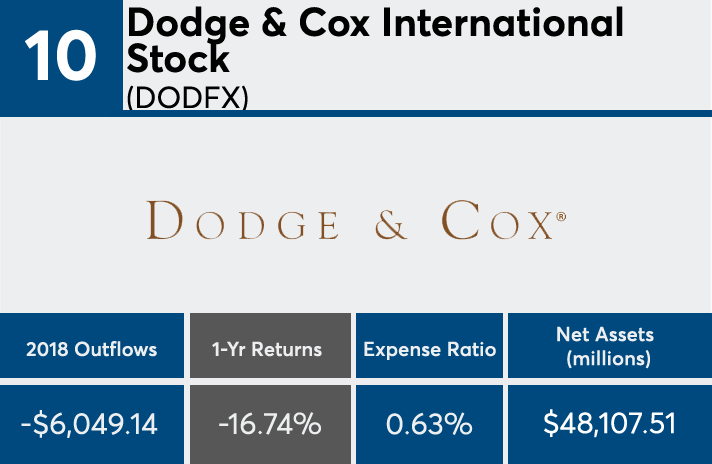
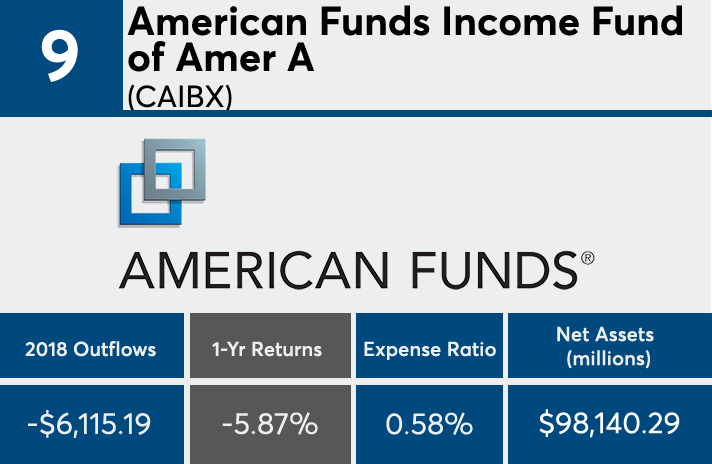
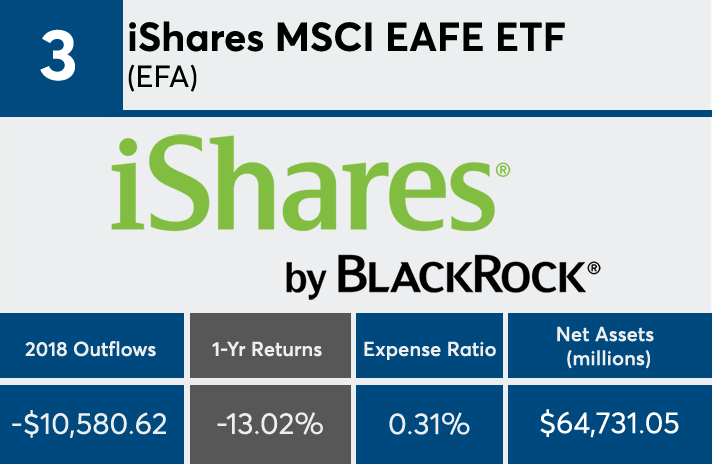
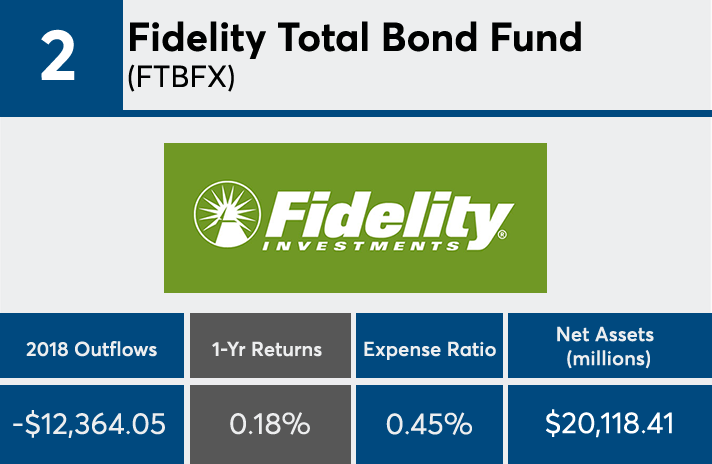
The fund industry’s 20 biggest outflows totaled $136.7 billion last year, a list dominated by funds that posted losses and carried relatively hefty price tags.
No fewer than 19 of the 20 mutual funds and ETFs with the biggest outflows reported returns in the red, some with losses worse than 20%, Morningstar Direct data shows. The average loss from the funds' oldest share classes was an average of 7.25% — only slightly worse than those with the biggest inflows, which had an average loss of 5.6%.
The data includes funds in which assets were transferred from one share class to another.
“Fund outflows spike during periods of market volatility and can be a result of profit-taking or performance chasing,” explains Greg McBride, chief financial analyst at Bankrate. “Since there was nowhere to hide in 2018, there were large outflows from funds of all types — domestic, international, growth, value, active, passive, stock and bond.”
One commonality among the funds with the biggest redemptions, which manage a collective $1.3 trillion in assets, were relatively high costs. With an average expense ratio of nearly 47 basis points, the funds collected significantly higher management fees than the 20 mutual funds and ETFs with the biggest inflows last year, data show. McBride suggests that is one of the main reasons the funds on the outflows list have fallen out of favor.
“Given the move from active funds to passive funds, it comes as no surprise that the average expense ratio on funds with the most outflows was 30 basis points higher than those with the biggest inflows,” McBride says.
Investors paid an average of 0.52% for fund investing in 2017, according to a Morningstar study that reviewed the asset-weighted average expense ratios of nearly 25,000 U.S. mutual funds and ETFs. That was 8% less than they paid in 2016.
Scroll through to see the 20 mutual funds and ETFs with the largest 2018 outflows. Estimated share class net flows were reported on Dec. 31 and one-year daily return figures are as of Jan. 10. Funds with investment minimums over $100,000 were excluded, as were leveraged and institutional funds. Assets and expense ratios for each fund are also listed. All data from Morningstar Direct.
This article has been updated to reflect that the data includes funds in which assets were transferred from one share class to another.


