Active funds with the biggest 10-year flows post losses in 2020

It’s a tale of two sets of asset flows: long term intake, short term stumbling blocks.

“You’ve just seen such dramatic swings of the market this year... it's now June and if you’ve been on a deserted island for the last five months you couldn’t have fathomed the movements we’ve seen,” says Marc Pfeffer, CIO of CLS Investments.

The 20 actively managed funds with the biggest 10-year net flows, and at least $500 million in AUM, raked in a combined $430 billion, Morningstar Direct data show. So far this year, however, all but five have recorded outflows and losses. Managers of the 15 other funds include Jeffrey Gundlach, James M. D'Arcy and Adam Ferguson.

“The actual year-to-date numbers don’t tell the whole story of how markets have swung, but the use of the active manager has played a huge role from an asset allocation and risk allocation perspective in 2020,” Pfeffer says.

Over the last 10 years, these funds recorded a gain of 6.72%, data show. In 2020, they have seen a loss of just over 1%. For comparison, the SPDR S&P 500 ETF Trust (SPY) and the SPDR Dow Jones Industrial Average ETF Tracker (DIA), posted 10-year gains of 13.15% and 12.48%, respectively. This year, they had losses of 2.74% and 6.83%. On the fixed-income side, the iShares Core US Aggregate Bond ETF (AGG) posted a 10-year return of 3.80% and YTD gain of 4.96%, data show.

Active flow leaders, more than half of which are from Vanguard, had an average net expense ratio of 27 basis points — nearly half the broader industry’s average of 0.45%, according to Morningstar’s most recent annual fee survey, which reviewed the asset-weighted average expense ratios of all U.S. open-end mutual funds and ETFs.

They were also cheaper than the industry’s biggest actively managed fund. The $207.6 billion American Funds Growth Fund of America (AGTHX), carried a 0.65% net expense ratio and recorded a net outflow of more than $58 billion. AGTHX had a 10-year gain of 13.71% and YTD gain of 4.54%, data show.

“Looking at 2020, it has been a year where active managers have come to the forefront, more than any time in the last decade,” Pfeffer says, noting that many advisors have stuck with stock pickers to navigate volatile markets. “A lot of these flows were predicated on the stock market movement that’s happened this year, and has seen so many people move to cash. It has been something where you want a good asset manager who can be nimble.”

Scroll through to see the 20 actively managed funds with the biggest 10-year net flows through June 1. Funds with less than $500 million in AUM and with investment minimums over $100,000 were excluded, as were leveraged and institutional funds. Assets and expense ratios, as well as year-to-date and one-, three-, five- and 10-year returns and net flows are listed for each. Daily returns are as of June 3. The data show each fund's primary share class. All data is from Morningstar Direct.

FP060520_20 copy.png

Vanguard Dividend Growth Investor (VDIGX)

1-Yr. Net Flows (millions): $3,493.71
3-Yr. Net Flows (millions): ($447.01)
5-Yr. Net Flows (millions): $1,719.73
YTD Return: -3.99%
1-Yr. Return: 7.84%
3-Yr. Annualized Return: 10.91%
5-Yr. Annualized Return: 10.44%
10-Yr. Annualized Return: 13.18%
FP060520_19 copy.png

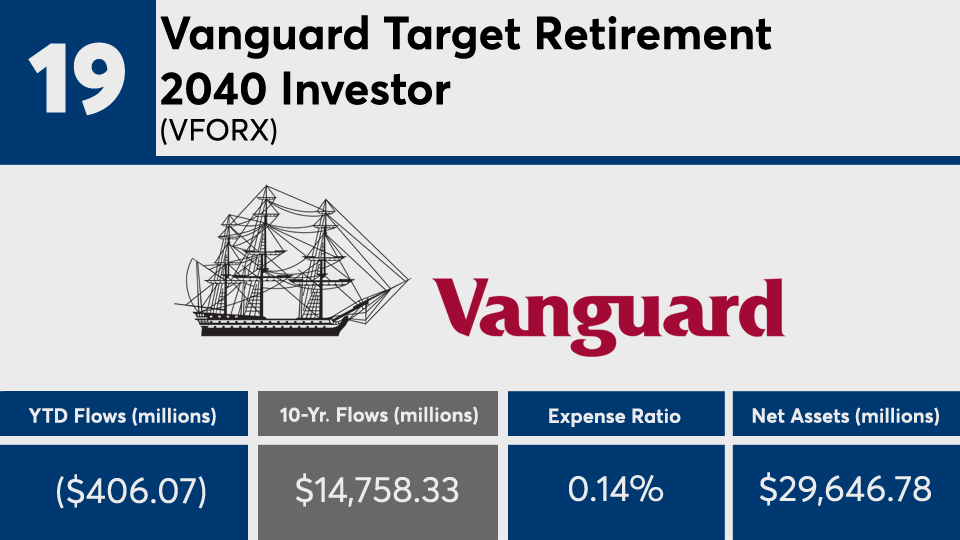
Vanguard Target Retirement 2040 Investor (VFORX)

1-Yr. Net Flows (millions): $1,149.23
3-Yr. Net Flows (millions): $4,595.84
5-Yr. Net Flows (millions): $4,726.86
YTD Return: -3.91%
1-Yr. Return: 7.84%
3-Yr. Annualized Return: 6.37%
5-Yr. Annualized Return: 6.49%
10-Yr. Annualized Return: 9.88%
FP060520_18 copy.png

Vanguard Intermediate-Term Investment-Grade Admiral (VFIDX)

1-Yr. Net Flows (millions): $764.10
3-Yr. Net Flows (millions): $2,498.37
5-Yr. Net Flows (millions): $9,041.11
YTD Return: 5.37%
1-Yr. Return: 9.54%
3-Yr. Annualized Return: 5.35%
5-Yr. Annualized Return: 4.85%
10-Yr. Annualized Return: 5.19%
FP060520_17 copy.png

Vanguard Limited-Term Tax-Exempt Admiral (VMLUX)

1-Yr. Net Flows (millions): $1,016.31
3-Yr. Net Flows (millions): $4,518.73
5-Yr. Net Flows (millions): $7,679.80
YTD Return: 1.33%
1-Yr. Return: 2.92%
3-Yr. Annualized Return: 2.27%
5-Yr. Annualized Return: 2.10%
10-Yr. Annualized Return: 1.92%
FP060520_16 copy.png

Vanguard International Growth Admiral (VWILX)

1-Yr. Net Flows (millions): $1,223.37
3-Yr. Net Flows (millions): $6,705.10
5-Yr. Net Flows (millions): $9,090.55
YTD Return: 7.61%
1-Yr. Return: 28.57%
3-Yr. Annualized Return: 12.14%
5-Yr. Annualized Return: 10.04%
10-Yr. Annualized Return: 10.52%
FP060520_15 copy.png

Vanguard Balanced Index Admiral (VBIAX)

1-Yr. Net Flows (millions): $2,572.91
3-Yr. Net Flows (millions): $6,113.00
5-Yr. Net Flows (millions): $9,393.68
YTD Return: 0.94%
1-Yr. Return: 13.21%
3-Yr. Annualized Return: 8.43%
5-Yr. Annualized Return: 7.76%
10-Yr. Annualized Return: 9.56%
FP060520_14 copy.png

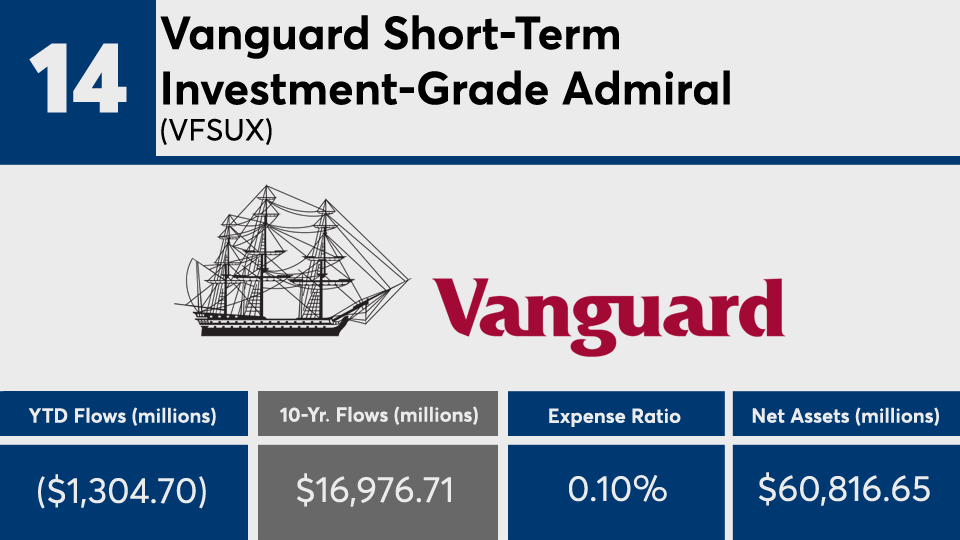
Vanguard Short-Term Investment-Grade Admiral (VFSUX)

1-Yr. Net Flows (millions): ($514.16)
3-Yr. Net Flows (millions): ($666.36)
5-Yr. Net Flows (millions): $4,202.10
YTD Return: 2.42%
1-Yr. Return: 4.74%
3-Yr. Annualized Return: 3.23%
5-Yr. Annualized Return: 2.87%
10-Yr. Annualized Return: 2.78%
FP060520_13 copy.png

Vanguard Equity-Income Admiral (VEIRX)

1-Yr. Net Flows (millions): $1,095.17
3-Yr. Net Flows (millions): $4,602.77
5-Yr. Net Flows (millions): $9,791.71
YTD Return: -9.75%
1-Yr. Return: 3.50%
3-Yr. Annualized Return: 5.81%
5-Yr. Annualized Return: 7.38%
10-Yr. Annualized Return: 11.90%
FP060520_12 copy.png

Vanguard Target Retirement 2030 Investor (VTHRX)

1-Yr. Net Flows (millions): $496.84
3-Yr. Net Flows (millions): $4,423.25
5-Yr. Net Flows (millions): $4,196.62
YTD Return: -2.39%
1-Yr. Return: 8.02%
3-Yr. Annualized Return: 6.21%
5-Yr. Annualized Return: 6.19%
10-Yr. Annualized Return: 9.17%
FP060520_11 copy.png

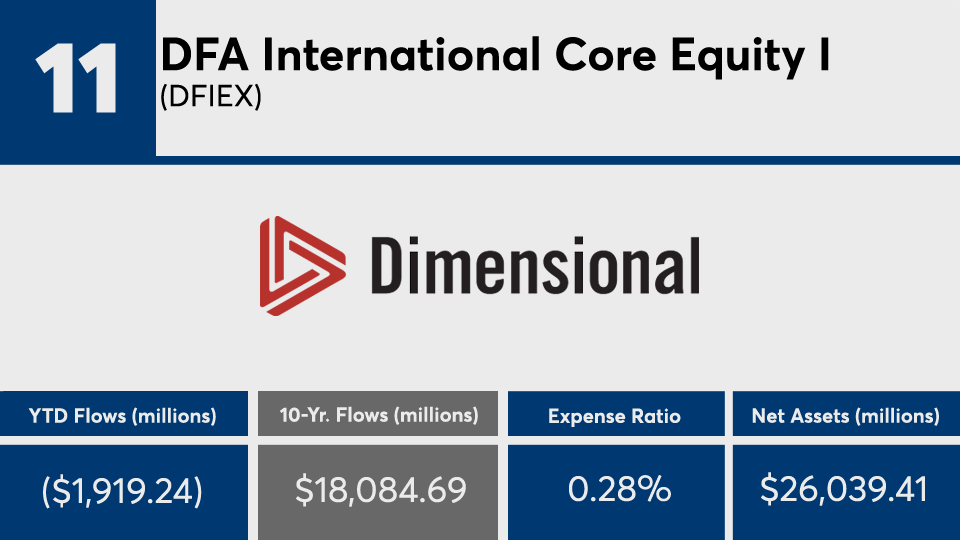
DFA International Core Equity I (DFIEX)

1-Yr. Net Flows (millions): ($1,919.01)
3-Yr. Net Flows (millions): $5,308.26
5-Yr. Net Flows (millions): $10,933.20
YTD Return: -12.25%
1-Yr. Return: -1.38%
3-Yr. Annualized Return: -0.67%
5-Yr. Annualized Return: 1.61%
10-Yr. Annualized Return: 5.99%
FP060520_10 copy.png

Vanguard Wellington Admiral (VWENX)

1-Yr. Net Flows (millions): ($5,105.52)
3-Yr. Net Flows (millions): ($10,179.89)
5-Yr. Net Flows (millions): ($6,944.01)
YTD Return: -2.62%
1-Yr. Return: 9.85%
3-Yr. Annualized Return: 7.59%
5-Yr. Annualized Return: 7.63%
10-Yr. Annualized Return: 9.76%
FP060520_9 copy.png

Lord Abbett Short Duration Income F (LDLFX)

1-Yr. Net Flows (millions): $1,603.30
3-Yr. Net Flows (millions): $5,180.04
5-Yr. Net Flows (millions): $9,269.56
YTD Return: -1.00%
1-Yr. Return: 1.29%
3-Yr. Annualized Return: 2.24%
5-Yr. Annualized Return: 2.30%
10-Yr. Annualized Return: 3.00%
FP060520_8 copy.png

DFA Emerging Markets Core Equity I (DFCEX)

1-Yr. Net Flows (millions): ($2,299.42)
3-Yr. Net Flows (millions): $1,994.65
5-Yr. Net Flows (millions): $6,367.80
YTD Return: -14.31%
1-Yr. Return: -5.51%
3-Yr. Annualized Return: -1.14%
5-Yr. Annualized Return: 1.30%
10-Yr. Annualized Return: 3.03%
FP060520_7 copy.png

Vanguard Wellesley Income Admiral (VWIAX)

1-Yr. Net Flows (millions): $577.70
3-Yr. Net Flows (millions): $791.93
5-Yr. Net Flows (millions): $6,270.57
YTD Return: 0.99%
1-Yr. Return: 9.06%
3-Yr. Annualized Return: 6.49%
5-Yr. Annualized Return: 6.58%
10-Yr. Annualized Return: 7.97%
FP060520_6 copy.png

PGIM Total Return Bond Z (PDBZX)

1-Yr. Net Flows (millions): $6,990.05
3-Yr. Net Flows (millions): $15,958.70
5-Yr. Net Flows (millions): $21,875.10
YTD Return: 2.19%
1-Yr. Return: 6.60%
3-Yr. Annualized Return: 4.85%
5-Yr. Annualized Return: 4.65%
10-Yr. Annualized Return: 5.26%
FP060520_5 copy.png

Dodge & Cox Income (DODIX)

1-Yr. Net Flows (millions): $1,009.75
3-Yr. Net Flows (millions): $6,342.92
5-Yr. Net Flows (millions): $9,476.23
YTD Return: 4.20%
1-Yr. Return: 8.67%
3-Yr. Annualized Return: 5.01%
5-Yr. Annualized Return: 4.44%
10-Yr. Annualized Return: 4.51%
FP060520_4 copy.png

Strategic Advisers Core Income (FPCIX)

1-Yr. Net Flows (millions): ($2,923.64)
3-Yr. Net Flows (millions): $2,661.13
5-Yr. Net Flows (millions): $5,599.95
YTD Return: 4.41%
1-Yr. Return: 8.20%
3-Yr. Annualized Return: 4.83%
5-Yr. Annualized Return: 4.32%
10-Yr. Annualized Return: 4.34%
FP060520_3 copy.png

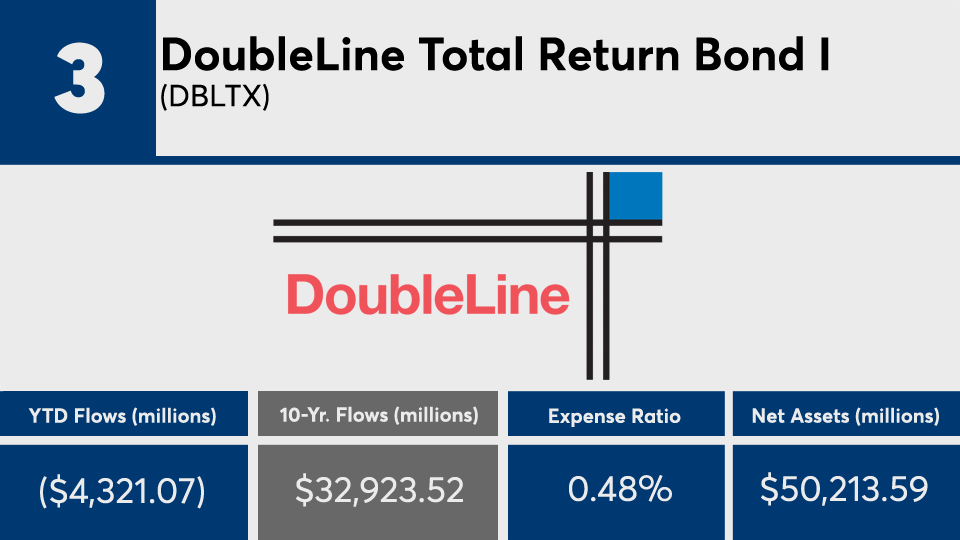
DoubleLine Total Return Bond I (DBLTX)

1-Yr. Net Flows (millions): ($2,663.82)
3-Yr. Net Flows (millions): ($4,832.76)
5-Yr. Net Flows (millions): $649.29
YTD Return: 1.27%
1-Yr. Return: 3.36%
3-Yr. Annualized Return: 3.22%
5-Yr. Annualized Return: 3.19%
10-Yr. Annualized Return: 5.17%
FP060520_2 copy.png

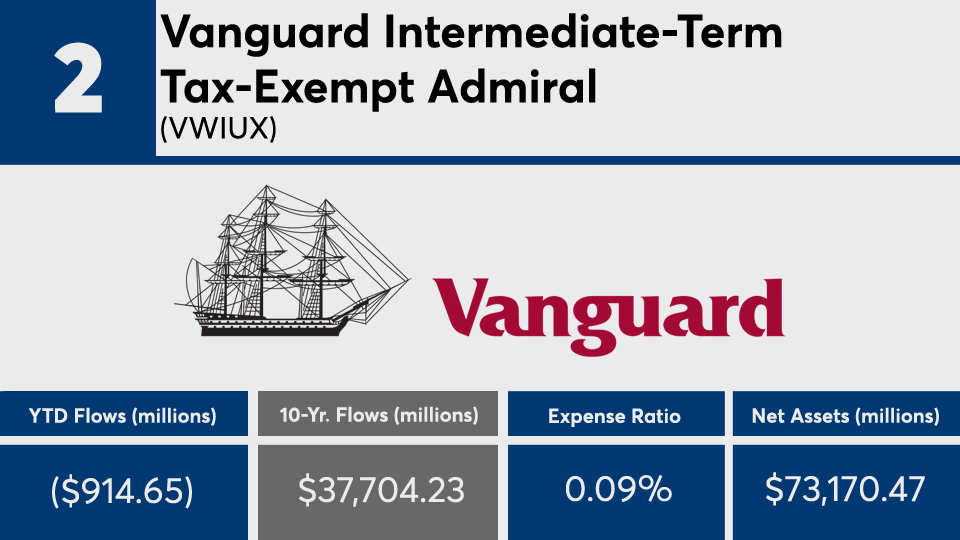
Vanguard Intermediate-Term Tax-Exempt Admiral (VWIUX)

1-Yr. Net Flows (millions): $3,548.96
3-Yr. Net Flows (millions): $15,648.46
5-Yr. Net Flows (millions): $24,466.69
YTD Return: 1.63%
1-Yr. Return: 4.05%
3-Yr. Annualized Return: 3.53%
5-Yr. Annualized Return: 3.57%
10-Yr. Annualized Return: 3.81%
FP060520_1 copy.png

American Funds Europacific Growth R6 (RERGX)

1-Yr. Net Flows (millions): $102.93
3-Yr. Net Flows (millions): $8,501.97
5-Yr. Net Flows (millions): $19,146.28
YTD Return: -5.31%
1-Yr. Return: 7.79%
3-Yr. Annualized Return: 4.47%
5-Yr. Annualized Return: 4.47%
10-Yr. Annualized Return: 7.56%
MORE FROM FINANCIAL PLANNING