The cost of investing has continued to drop for nearly a decade, falling 4 basis points in 2017 alone, according to the Investment Company Institute. So, it’s no surprise that the worst-performing active funds were among the priciest.
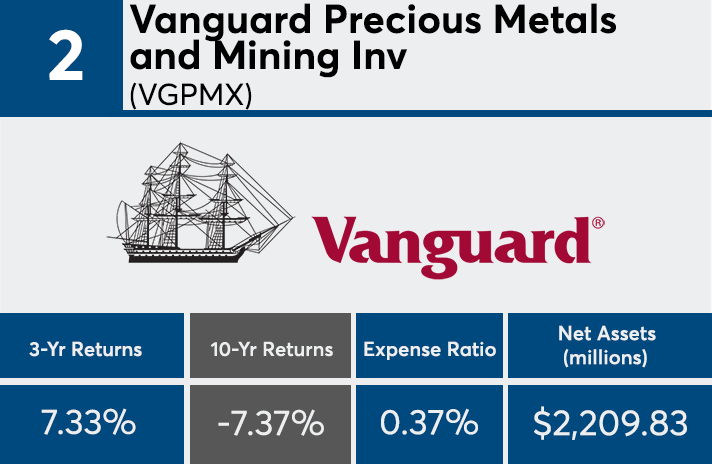
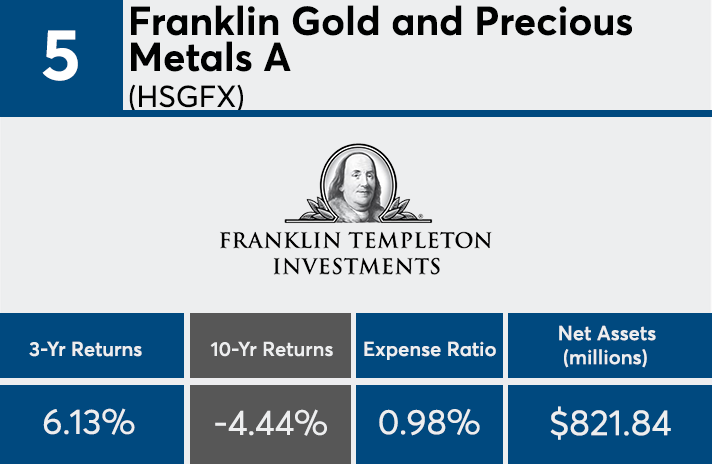
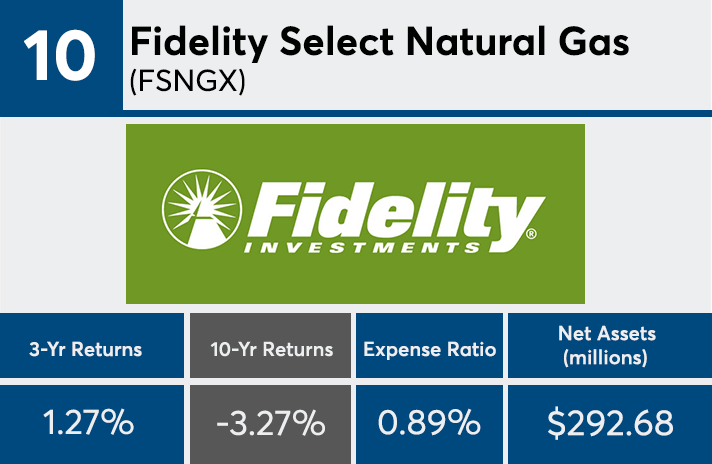
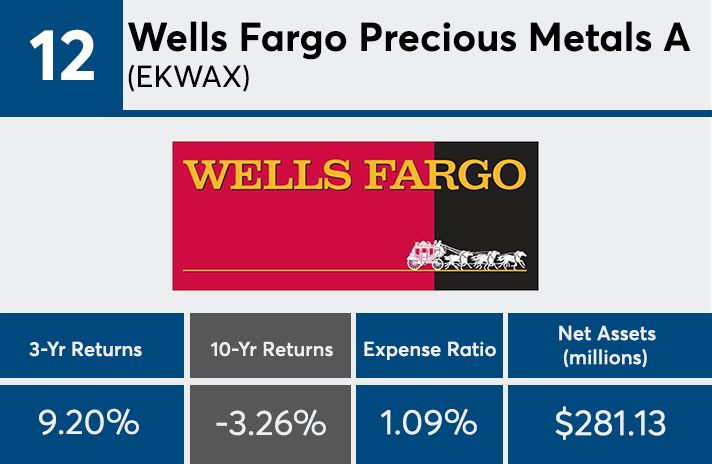
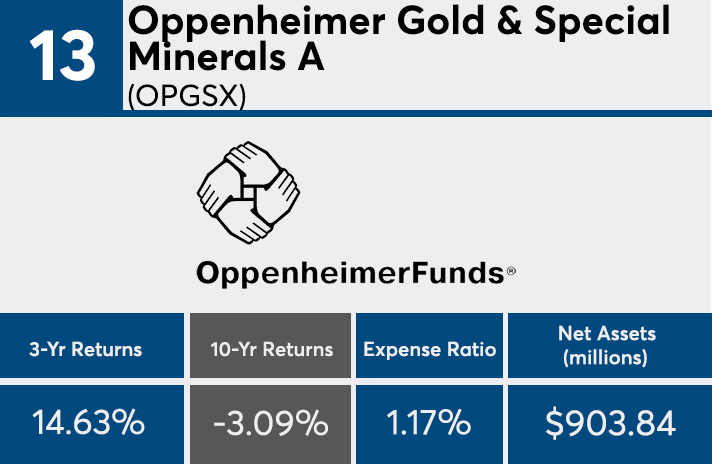
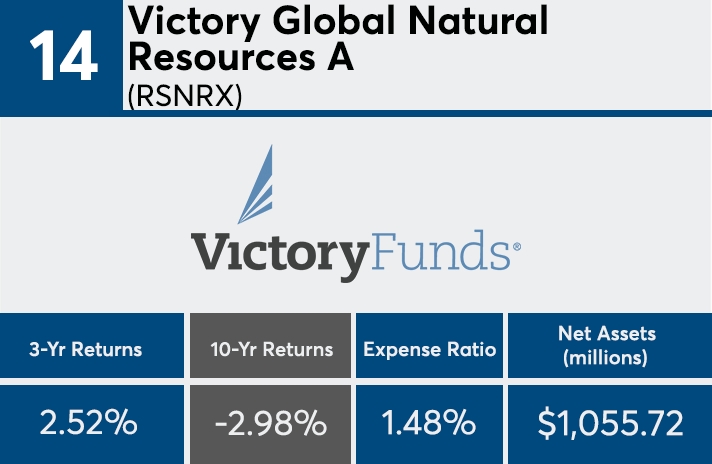
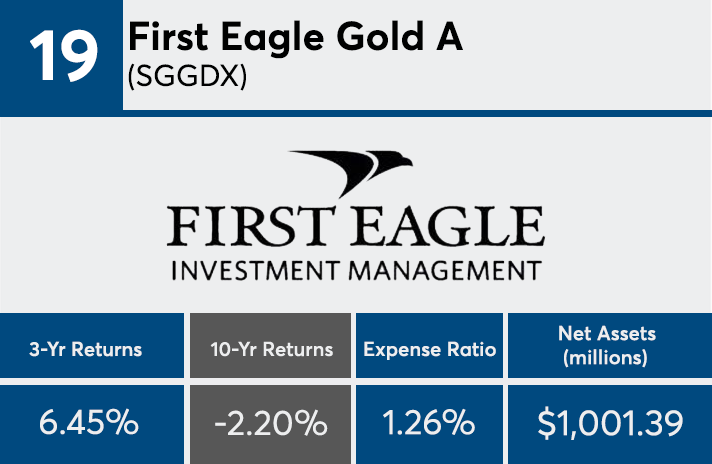
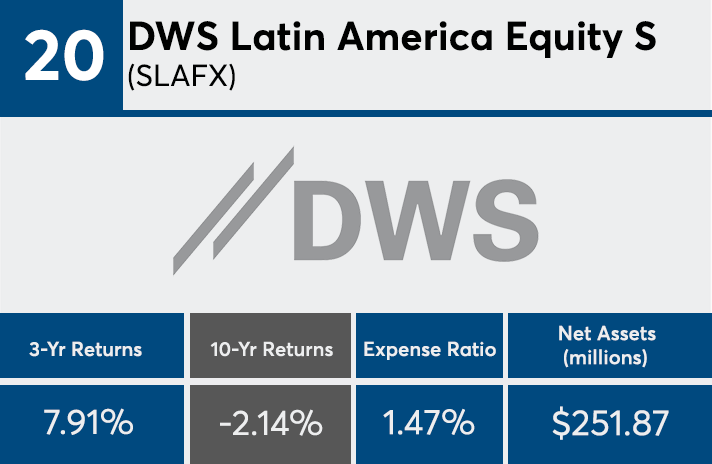
In the years following the financial crisis, oil prices dampened energy fund performance and narrow sectors with higher transaction costs also took some of the largest hits, says Greg McBride, chief financial analyst at Bankrate.com. Funds with the worst 10-year returns were largely sector funds like commodities, precious metals and energy.
“A global economic recession was a big negative for commodities,” McBride says. “When the global economy was booming in ‘05 and ’06, commodity prices were increasing rapidly because of demand. Following the global recession, the demand for those fell off the table.”
The worst-performing actively managed equity mutual funds’ expense ratios, at 1.19%, were closer to the average fee in 1996 when the products cost investors an average of 1.08%, according to ICI. Despite their cheapening price tags, funds with the worst returns over the past decade were several basis points higher than the average active product, which declined to 0.78% in 2017 from 0.82% in 2016. The top-performers were generally cheaper the funds on this list at an average of 0.87%.
“During the 2007 – 2009 financial crisis, actively managed domestic equity mutual fund assets decreased markedly, leading their expense ratios to rise in 2009,” ICI economists James Duvall and Morris Mitler wrote in the company’s 2017 report, Trends in the Expenses and Fees of Funds. “As the stock market recovered, however, actively managed domestic equity mutual fund assets rebounded and their expense ratios fell. Since 2008, assets in these funds have grown substantially and their expense ratios have fallen significantly.”
Although their fees consistently decreased, outflows from the products persisted. Active funds recorded $7 billion in net outflows last year, compared to passive funds which saw $692 billion in inflows, according to Morningstar. However, actively managed funds with expense ratios among the lowest 5% reported inflows, according to ICI data. Domestic active funds with expense ratios under 0.56% reported inflows of $3 billion in 2017, ICI found. By comparison, those with expense ratios in the top 75th percentile, at greater than or equal to 1.51%, had outflows of $27 billion.
“Markets go up and markets go down, and sectors rotate from hot to cold; so whether or not you stay in has much to do with why you got into it in the first place,” McBride notes, adding that advisors must ask, “What was the thesis, what was the objective in adding [the funds] in the first place? If it was chasing good performance, that’s not a really good reason.”
Scroll through to see the 20 actively managed funds with the worst returns over the past decade. Funds with less than $250 million in client assets and investment minimums over $100,000 were excluded, as were leveraged and institutional funds. We also show three-year returns, assets and expense ratios for each fund. All data from Morningstar Direct.

