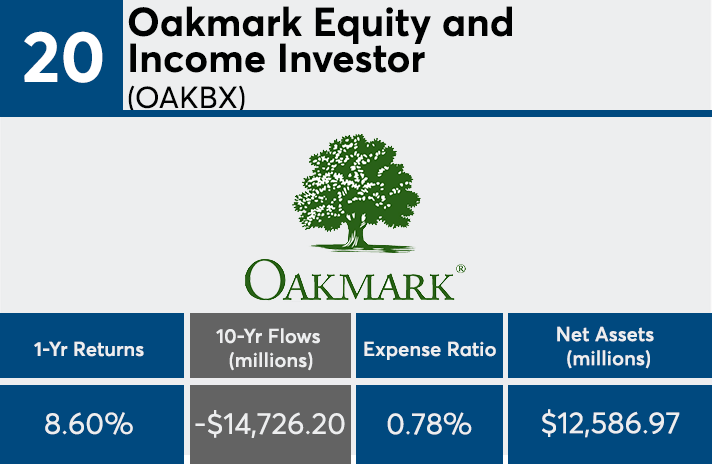
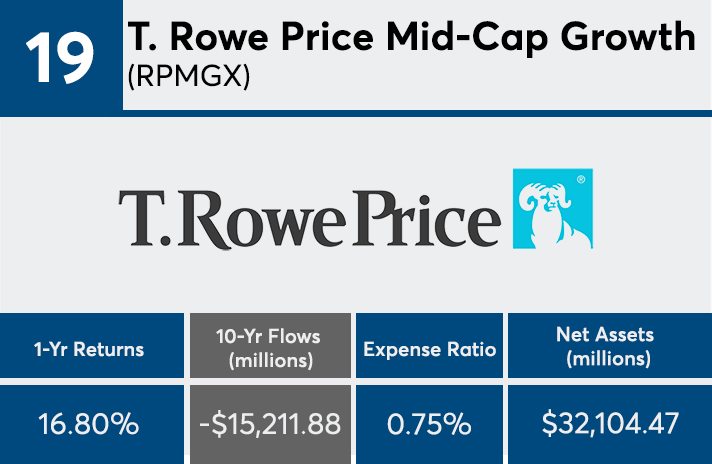
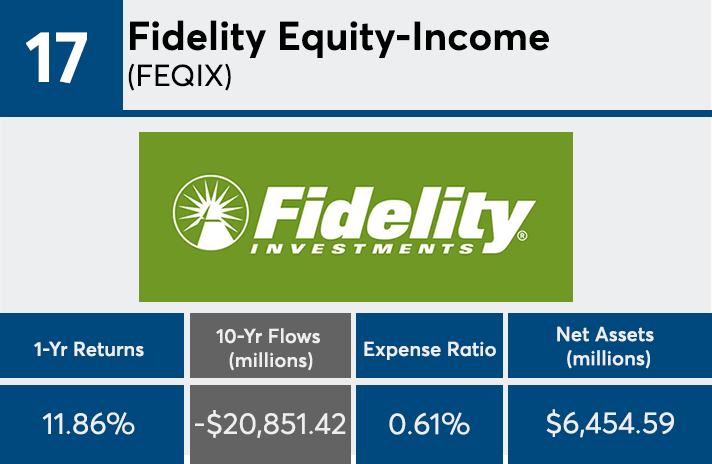
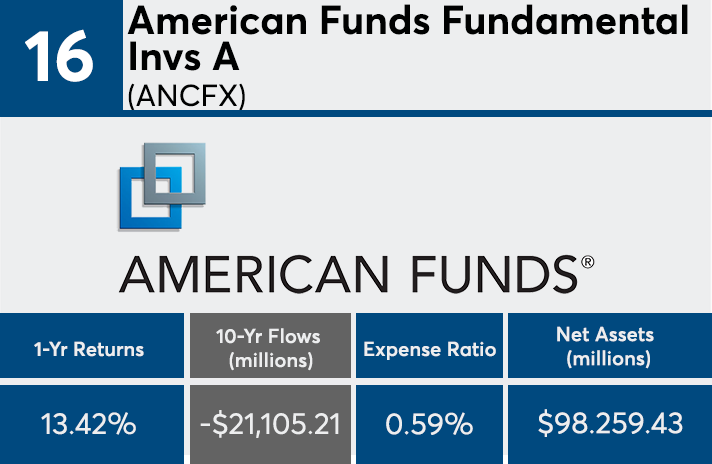
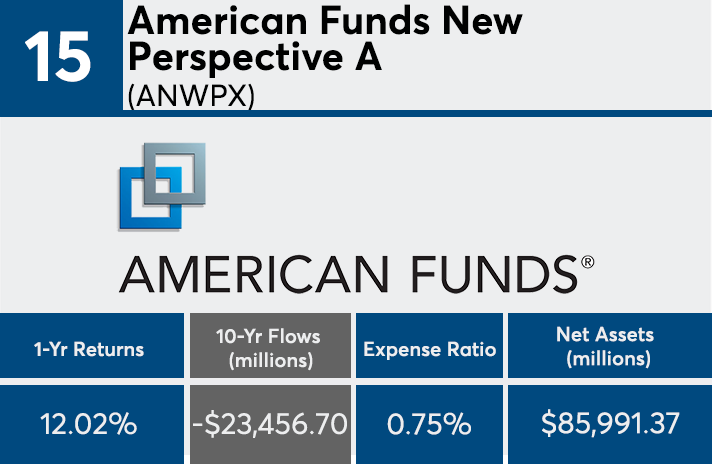
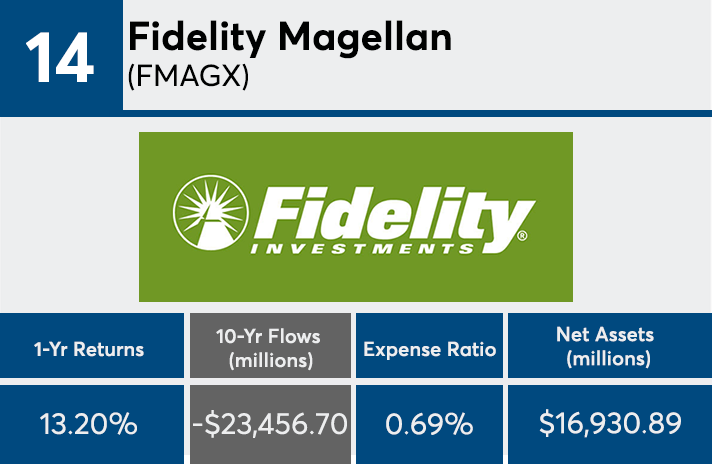
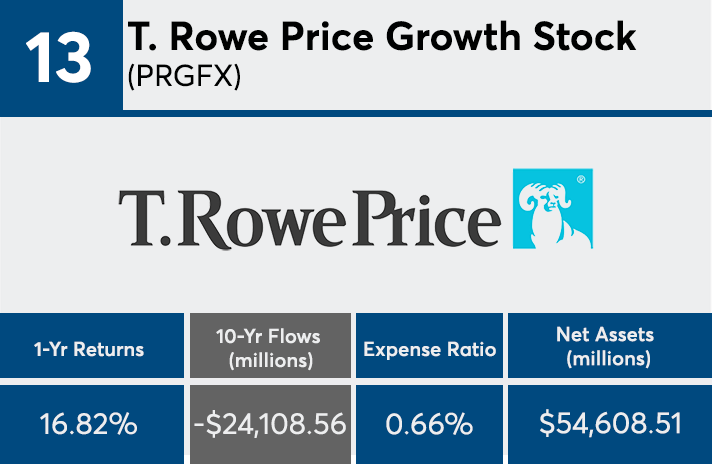
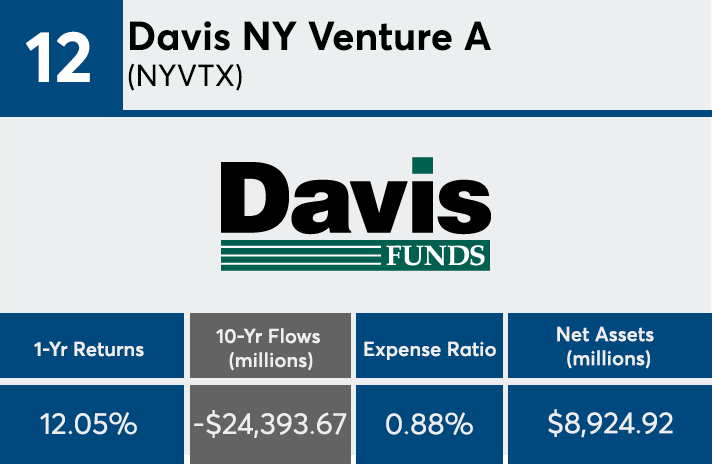
The investment world’s shift to passive management has pulled some of the largest funds to the top of the decade’s outflow ranking.
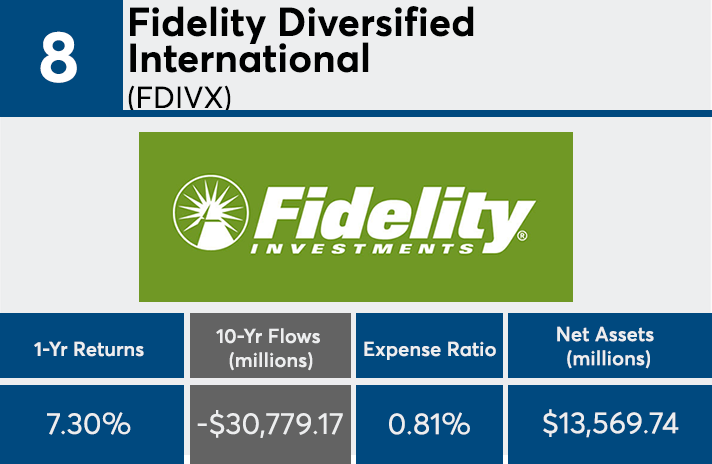
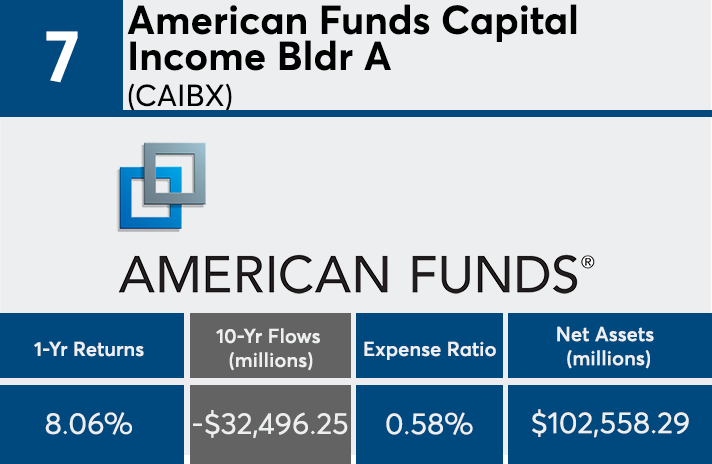
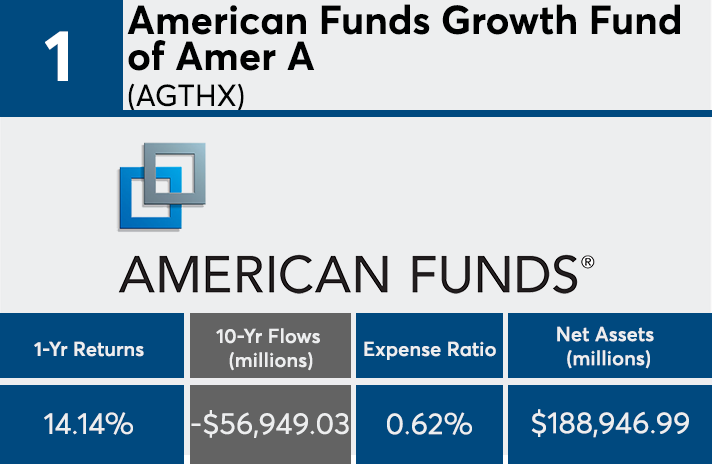
The 20 funds with the biggest net outflows over 10 years, all of which are mutual funds, lost a combined $586.81 billion in assets under management, Morningstar Direct data show. While nearly all the funds produced double-digit annualized returns, the ranking is most illustrative of the broader trend toward passive investing, Bankrate senior financial analyst Greg McBride says.
“The largest outflows are generally not an indictment of the funds’ performance. Rather, it is consistent with the move from active to passive, as the largest outflows were all from actively managed funds,” he says.
With an average 10-year annualized return of 12.7%, funds with the largest outflows underperformed the S&P 500’s 14.53%, as measured by SPDR S&P 500 ETF Trust (SPY), and the Dow’s 14.64%, as measured by the SPDR Dow Jones Industrial Average ETF (DIA). McBride says this should be no surprise for advisors analyzing these products.
“The mutual funds showing the biggest outflows over the past 10 years are a who’s who of the largest funds,” McBride adds. “After all, the money had to be in-house before it could flow out.”
With a net inflow of nearly $69 billion, the industry’s largest fund, the Vanguard Total Stock Market Index Fund Admiral Shares (VTSAX), has $804.5 billion in AUM, an expense ratio of 0.04% and a 10-year return of 14.83%, data show. A ranking of the 20 funds with the largest inflows, three of which are ETFs, shows a combined inflow of $376.5 billion with an average expense ratio of 0.35%.
The funds on the largest outflows ranking, which have a combined $1.3 trillion in AUM, have an average expense ratio of 0.68%, more than 50 basis points higher than the
“Looking at the massive outflows amid a decade of strong returns from many of the largest funds, one can’t help but wonder if individual investors are the biggest contributors to their own underperformance,” McBride says.
Scroll through to see the 20 mutual funds and ETFs ranked by the largest net share class outflows through April 30. Funds with less than $500 million in AUM and investment minimums over $100,000 were excluded, as were leveraged and institutional funds. Assets and expense ratios for each fund, as well as 10-year returns through May 22, are also listed. The ranking is based on funds' primary share classes.
