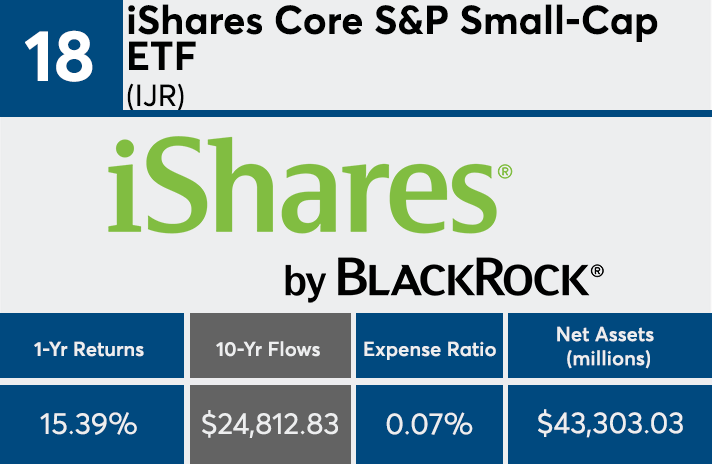
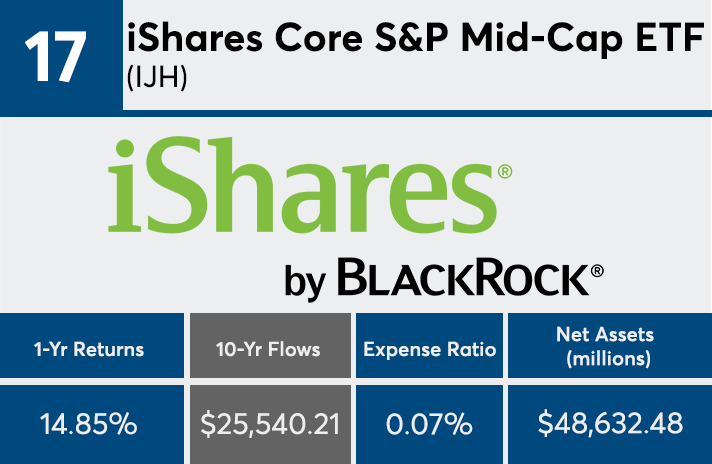
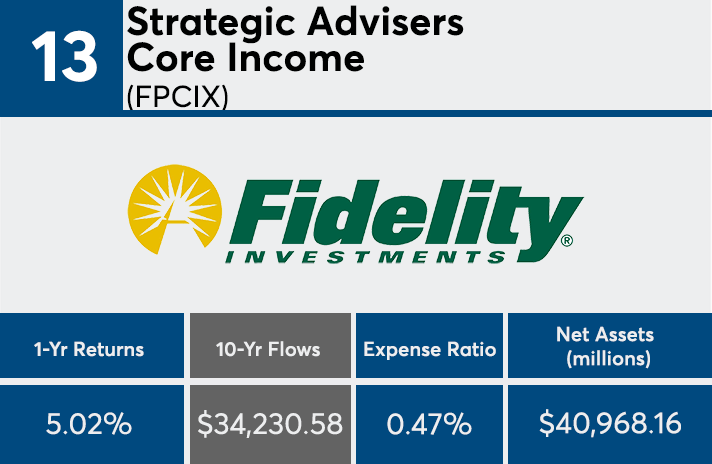
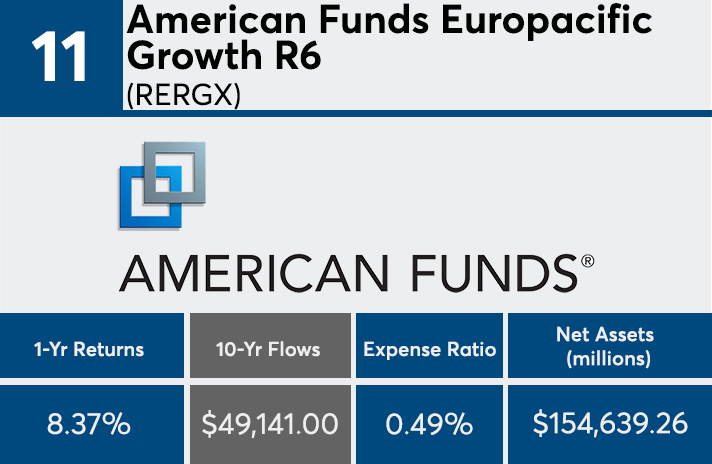
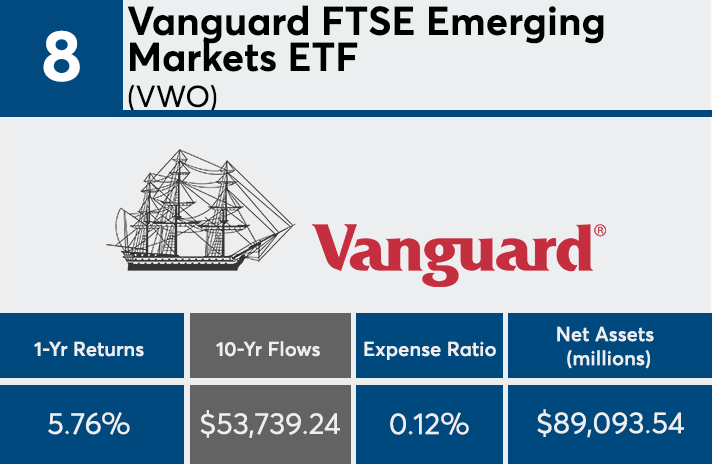
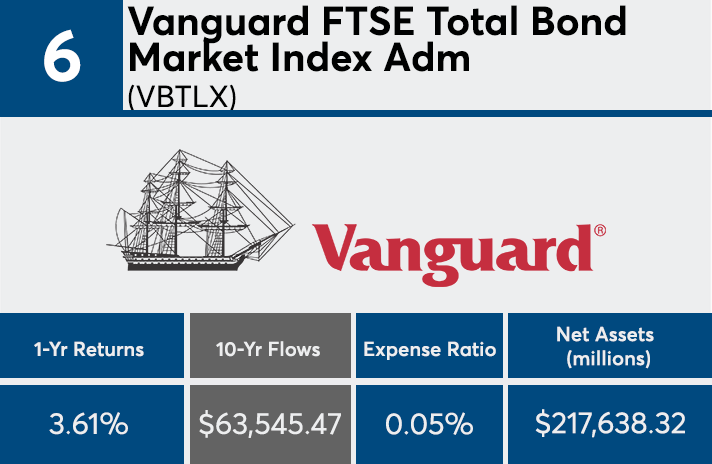
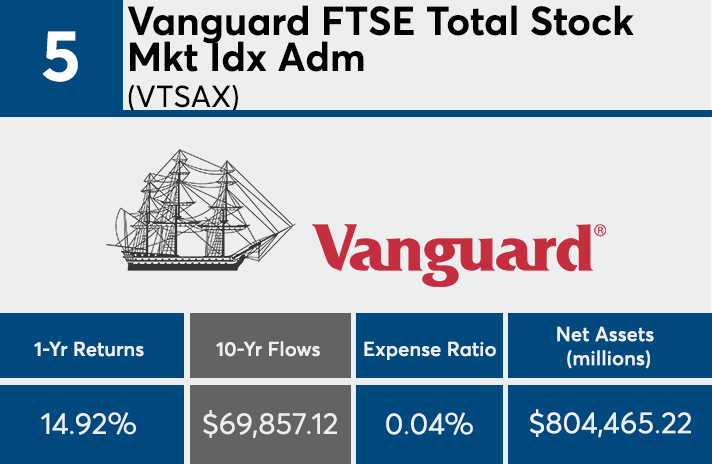
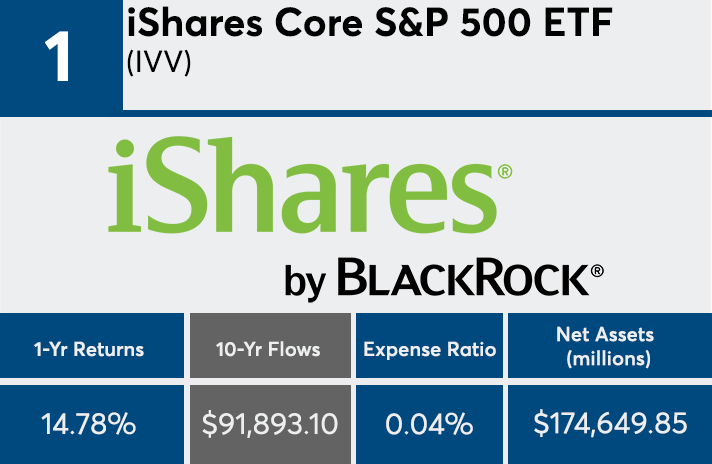
When advisors talk about mutual funds or ETFs, the numbers are mostly in the billions, sometimes in the millions. But over the last decade, the 20 funds with the biggest net inflows gathered roughly $1 trillion in assets.
With around $3.4 trillion in combined AUM, according to Morningstar Direct, these mutual funds and ETFs have all benefited from the industry’s ongoing trend toward passively managed investment products, says Greg McBride, senior financial analyst at Bankrate.
“Fund flows over the past decade reflect the increased movement toward passive, or index, investing,” McBride says. “Even the actively managed funds seeing the biggest inflows have expense ratios below 0.5%.”
Fees among the top 20 were significantly lower than the industry average, data show. At around 14 basis points, these funds were 34 basis points cheaper than the 48 basis points investors paid for fund investing on average last year, according to Morningstar’s most recent annual fee survey, which reviewed the asset-weighted average expense ratios of all U.S. open-end mutual funds and ETFs.
For comparison, the industry’s largest fund, the Vanguard Total Stock Market Index Fund Admiral Shares (VTSAX), has $804.5 billion in AUM, an expense ratio of 0.04% and 10-year return of 14.92%, data show. The 20 largest funds in the industry, meanwhile, brought in a combined $304.2 billion in net assets with an average expense ratio of 0.34%. Those funds had an average return of 11.7%, roughly two percentage points higher than the 9.33% average return of the inflow leaders.
Nevertheless, both the largest funds and inflow leaders underperformed the S&P 500 and Dow over the same period, which returned 14.82%, as measured by the SPDR S&P 500 ETF (SPY), and 14.71%, as measured by the SPDR Dow Jones Industrial Average ETF (DIA), respectively. When considering the funds that attracted the most money over 10 years, McBride says analyzing the leaders underscores the frenzied trend for low-cost, diversified products.
“A portfolio diversified among the entire U.S. stock market, international stock markets and the bond market can be had with three low-cost index mutual funds or ETFs,” McBride says. “The massive inflows to such a strategy over the past 10 years underscores the simplicity and low costs investors are craving.”
Scroll through to see the 20 mutual funds and ETFs ranked by the largest month-end net share class flows through April 30. Funds with less than $500 million in AUM and investment minimums over $100,000 were excluded, as were leveraged and institutional funds. Assets and expense ratios for each fund, as well as 10-year daily returns through May 17, are also listed. The data shows each fund's primary share class.


