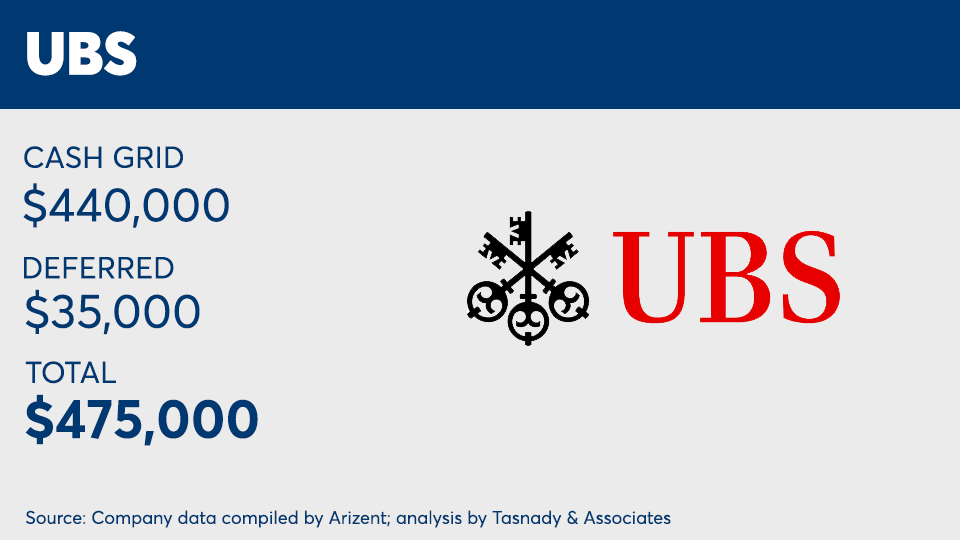
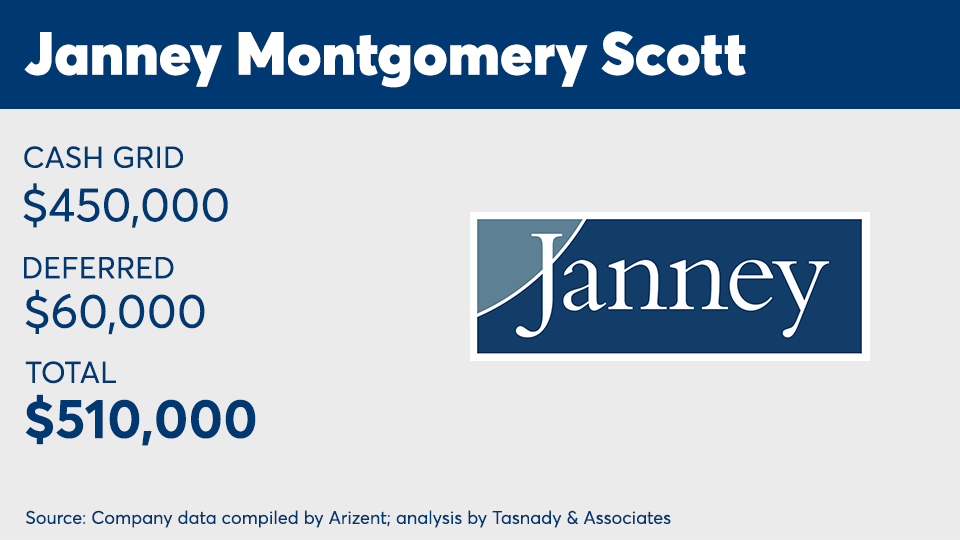
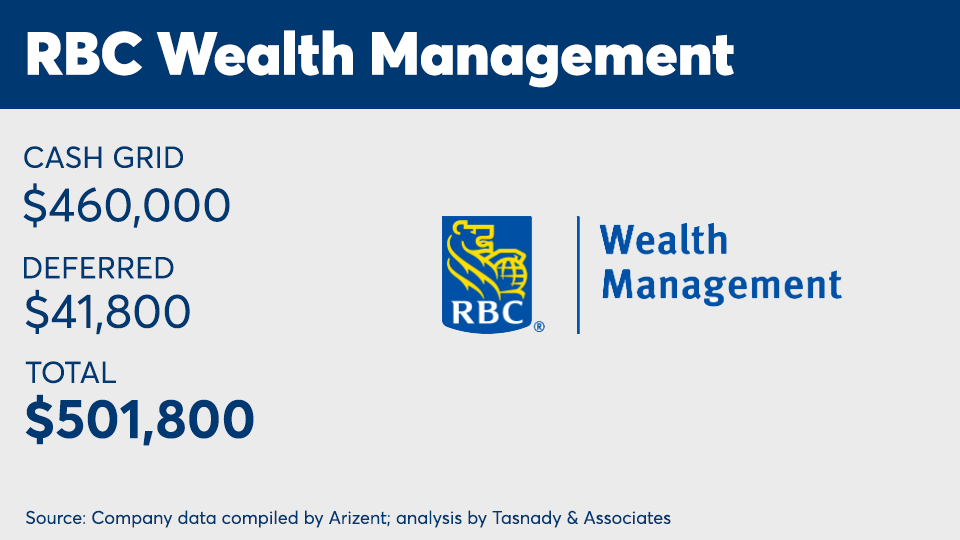
Where can advisors generating $1 million in annual production earn the most?
It’s a straightforward question, but with bonus, penalties and other factors weighing in, one with a frustratingly elusive answer: It depends.
To help advisors sort through and fill in the X-factors, On Wall Street presents the third installment of its annual analysis of base pay at wirehouses and national and regional broker-dealers.
Please note: Some planned changes at firms such as Morgan Stanley and Wells Fargo have been temporarily postponed in light of the coronavirus and its accompanying economic upheaval.
Scroll through to see how base pay varies at firms under 2020 comp plans.
Data was collected by Arizent and analysis conducted by Tasnady & Associates.
A note about this year’s analysis: A number of special policies are not included here because they do not affect 100% of the advisor population evenly and therefore are more haphazard to compare. Individual results can vary dramatically, based on the mix of business and policies at each firm. For example, pay can rise from special bonuses and fall from penalties such as discount sharing, small client limits and ticket charges.
Assumptions for basic pay (prior to special policies/contingent bonuses):
- 25% in individual stocks; 25% in individual bonds; 25% in mutual funds; 25% in fee-based (wrap accounts, managed accounts, etc.)
- Year-end basic bonuses are shown in deferred totals.
- Length of service is assumed to be 10 years.
- Assumes no impacts from bonuses based on growth, asset-based bonuses or other behavior-based awards.
- Excludes voluntary deferral matches, 401(k) matches or profit-sharing contributions, unless otherwise noted.
- Does not include: T&E expense allowance, discount sharing or ticket charge expense assumptions, small household or small ticket policy assumptions, or value of any options awards.


