Biggest actively managed funds with the worst 10-year returns

Complimentary Access Pill
Enjoy complimentary access to top ideas and insights — selected by our editors.

Bigger doesn’t necessarily mean better — at least over the long term.

Among the decade’s worst-performing actively managed funds — those with more than $1 billion in assets under management — were a handful of products with stellar short-term returns, Morningstar Direct data show. With an average 10-year loss of 1.65%, the funds in this ranking largely underperformed the broader industry over the YTD, 1-, 3- and 5-year time horizons.

For comparison, the SPDR S&P 500 ETF Trust (SPY) and the SPDR Dow Jones Industrial Average ETF Trust (DIA) posted 10-year returns of 13.65% and 12.55%, respectively. Compared with the funds’ average gain of 1.48%, the index trackers generated returns of 7.42% and 0.94%, respectively.

In bonds, the AGG has generated gains of 6.38% and 3.46% over the YTD and 10-year periods.

“Advisors cannot prevent clients from looking at historical returns, and if they own the funds they’re naturally going to be interested,” says Albert Brenner, director of investment and economic research at People's United Advisors. “We have to look at what our expectations can be from past performance. Can a fund that's produced 30% to 40% return continue to do that?”

The funds on this list, most of which track commodities, precious metals and short-term munis, had an average expense ratio of 67 basis points. Investors paid an average of 0.45% for fund investing last year, according to Morningstar’s most recent annual fee survey.

When speaking with clients focused on fund managers’ performance in a year defined by coronavirus-driven market volatility, advisors must help them go against their intuition, Brenner says.

“You have to be a contrarian,” Brenner says of those with a long-term investing horizon. “You have to be able to put that hat on, and to say, ‘This has been successful, so why should I think that's going to continue?’ And ‘This has not been successful, so why should I not expect that to continue?’ That runs counter to our instinct to keep the winners and sell the losers.”

Scroll through to see the 20 actively managed funds with more than $1 billion in AUM and the worst returns through Oct. 8. Funds with less than $100 million in AUM were excluded, as were leveraged and institutional funds. Assets and expense ratios, as well as YTD, one-, three- and five- returns are also listed for each. The data show each fund's primary share class. All data is from Morningstar Direct.

FP101320_20 copy.png

BNY Mellon National Short Term Muni Bond M (MPSTX)

1-Yr. Return: 1.77%
3-Yr. Annualized Return: 1.67%
5-Yr. Annualized Return: 1.34%
FP101320_19 copy.png

American Funds Short-Term Bond Fund of America A (ASBAX)

1-Yr. Return: 3.42%
3-Yr. Annualized Return: 2.33%
5-Yr. Annualized Return: 1.71%
Front Load: 2.50%
FP101320_18 copy.png

DFA Two-Year Global Fixed-Income I (DFGFX)

1-Yr. Return: 1.33%
3-Yr. Annualized Return: 1.87%
5-Yr. Annualized Return: 1.45%
FP101320_17 copy.png

DFA CA Short-Term Municipal Bond I (DFCMX)

1-Yr. Return: 0.98%
3-Yr. Annualized Return: 0.98%
5-Yr. Annualized Return: 0.92%
FP101320_16 copy.png

DFA Short Term Municipal Bond I (DFSMX)

1-Yr. Return: 1.07%
3-Yr. Annualized Return: 1.08%
5-Yr. Annualized Return: 0.96%
FP101320_15 copy.png

DFA One-Year Fixed-Income I (DFIHX)

1-Yr. Return: 1.04%
3-Yr. Annualized Return: 1.65%
5-Yr. Annualized Return: 1.29%
FP101320_14 copy.png

SEI Short Duration Municipal F (STET) (SUMAX)

1-Yr. Return: 1.66%
3-Yr. Annualized Return: 1.46%
5-Yr. Annualized Return: 1.03%
FP101320_13 copy.png

T. Rowe Price New Era (PRNEX)

1-Yr. Return: -7.28%
3-Yr. Annualized Return: -4.71%
5-Yr. Annualized Return: 0.69%
FP101320_12 copy.png

DFA Emerging Markets Value I (DFEVX)

1-Yr. Return: -3.61%
3-Yr. Annualized Return: -3.94%
5-Yr. Annualized Return: 4.46%
FP101320_11 copy.png

Janus Henderson Overseas D (JNOSX)

1-Yr. Return: 12.77%
3-Yr. Annualized Return: 2.8%
5-Yr. Annualized Return: 4.71%
FP101320_10 copy.png

VanEck International Investors Gold A (INIVX)

1-Yr. Return: 54.43%
3-Yr. Annualized Return: 18.94%
5-Yr. Annualized Return: 20.82%
Front Load: 5.75%
FP101320_09 copy.png

Invesco Gold & Special Minerals A (OPGSX)

1-Yr. Return: 52.36%
3-Yr. Annualized Return: 19.45%
5-Yr. Annualized Return: 22.32%
Front Load: 5.50%
FP101320_08 copy.png

Invesco SteelPath MLP Select 40 Y (MLPTX)

1-Yr. Return: -39.87%
3-Yr. Annualized Return: -17.29%
5-Yr. Annualized Return: -10.36%
FP101320_07 copy.png

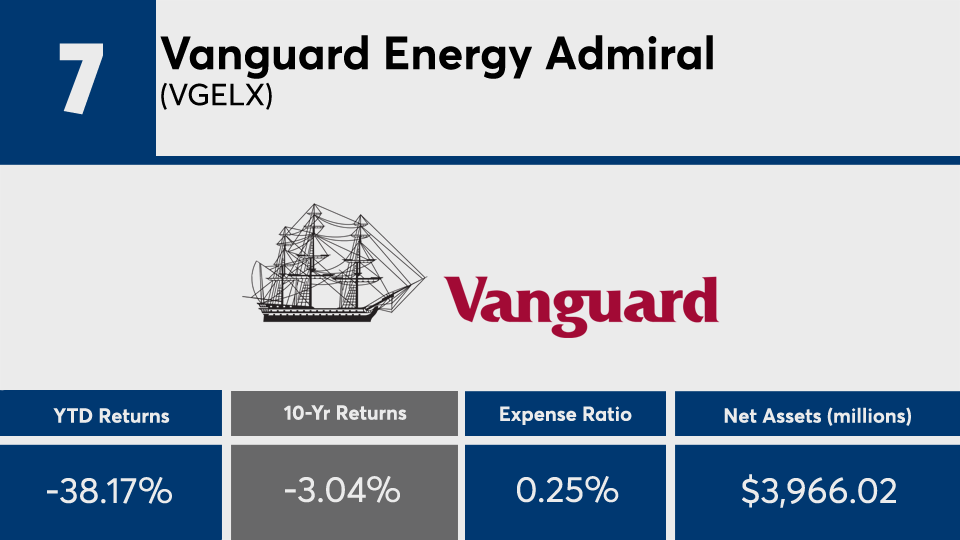
Vanguard Energy Admiral (VGELX)

1-Yr. Return: -32.15%
3-Yr. Annualized Return: -14.68%
5-Yr. Annualized Return: -6.75%
FP101320_06 copy.png

Sprott Gold Equity Investor (SGDLX)

1-Yr. Return: 43.11%
3-Yr. Annualized Return: 13.31%
5-Yr. Annualized Return: 15.01%
FP101320_05 copy.png

Fidelity Select Gold (FSAGX)

1-Yr. Return: 39.86%
3-Yr. Annualized Return: 14.54%
5-Yr. Annualized Return: 17.18%
FP101320_04 copy.png

Franklin Gold and Precious Metals A (FKRCX)

1-Yr. Return: 49.88%
3-Yr. Annualized Return: 17.77%
5-Yr. Annualized Return: 17.36%
Front Load: 5.50%
FP101320_03 copy.png

Invesco SteelPath MLP Income A (MLPDX)

1-Yr. Return: -38.92%
3-Yr. Annualized Return: -16.68%
5-Yr. Annualized Return: -10.5%
Front Load: 5.50%
FP101320_02 copy.png

Fidelity Series Commodity Strategy (FCSSX)

1-Yr. Return: -6.86%
3-Yr. Annualized Return: -3.71%
5-Yr. Annualized Return: -3.68%
FP101320_01 copy.png

Vanguard Global Capital Cycles Investor (VGPMX)

1-Yr. Return: 10.99%
3-Yr. Annualized Return: -5.63%
5-Yr. Annualized Return: 4.13%
MORE FROM FINANCIAL PLANNING