Market volatility sparked by the threat of a trade war with China has flipped the script for funds that track the region over the last year, a point experts do not hesitate to note as a reason for sticking to a long-term strategy.
The 20 top-performing China region funds underperformed the broader market over the past five years, data show. With an average gain of 7.02%, the lineup of mutual funds, ETFs and closed-end products were outpaced by the Dow’s 12.78% gain, as tracked by the SPDR Dow Jones Industrial Average ETF (DIA), the S&P 500’s 11.38% gain, as tracked by the SPDR S&P 500 ETF (SPY), and MSCI's 8.26% gain, as tracked by the iShares MSCI World ETF (URTH), over the same period. In the past year, volatility, especially in the onshore China market, painted a different picture, says Jackie Choy, director of ETF research for Asia at Morningstar Investment Management Asia.
“Taking the CSI 300 Index as an example, just in the month of October 2018, the index fell 9%,” Choy said. “Hence, taking the one-year return figure, say as of yesterday, would have been very different from taking a one-year return figure as of the quarter-end. We would put more emphasis on the longer-term returns, and be more cautious when looking at the short-term returns.”
Over the past year, funds tracking the China region nearly doubled their gains to an average of more than 15%, data show. The Dow posted an average one-year gain of 8.26%, while the S&P 500 had a 10.90% gain and MSCI had a 9.76% gain, over the same period.
The top-performers carry different exposures, “in terms of onshore/offshore China, sector and other nuances,” Choy says, adding that the varying “exposures have performed differently at different time span.”
Fees associated with these funds also differ greatly from one product to the next. With an average net expense ratio of 97 basis points, the expense ratios here ranged from as low as 0.32% to nearly 200 basis points. On average, they were more than twice the 0.48% investors paid on average for fund investing last year, according to Morningstar’s most recent annual fee survey, which reviewed the asset-weighted average expense ratios of all U.S. open-end mutual funds and ETFs. The industry’s largest fund, the Vanguard Total Stock Market Fund (VTSAX), has an 0.04% expense ratio and 11.03% gain over the last five years.
Research into management teams behind any fund is critical to helping clients build a well-diversified portfolio, says Germaine Share, associate director of manager research at Morningstar Investment Management Asia.
“The investment team should use a clearly defined, repeatable investment process which has been tested over multiple market cycles,” Share says. “These qualities should help the fund weather any short-term volatility and generate above-average returns for investors over the longer term, and we encourage investors to stick with their fund picks if they have a long-term constructive view on the asset class.”
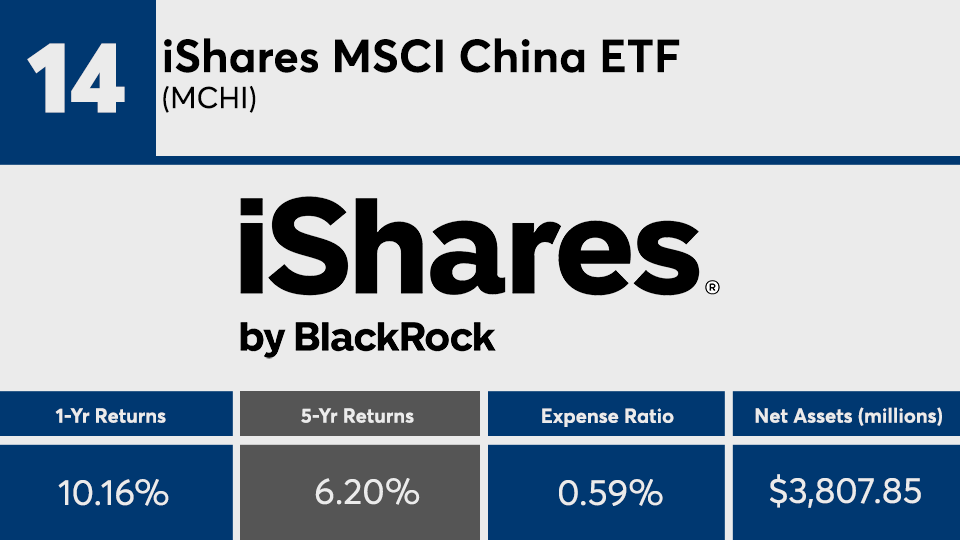
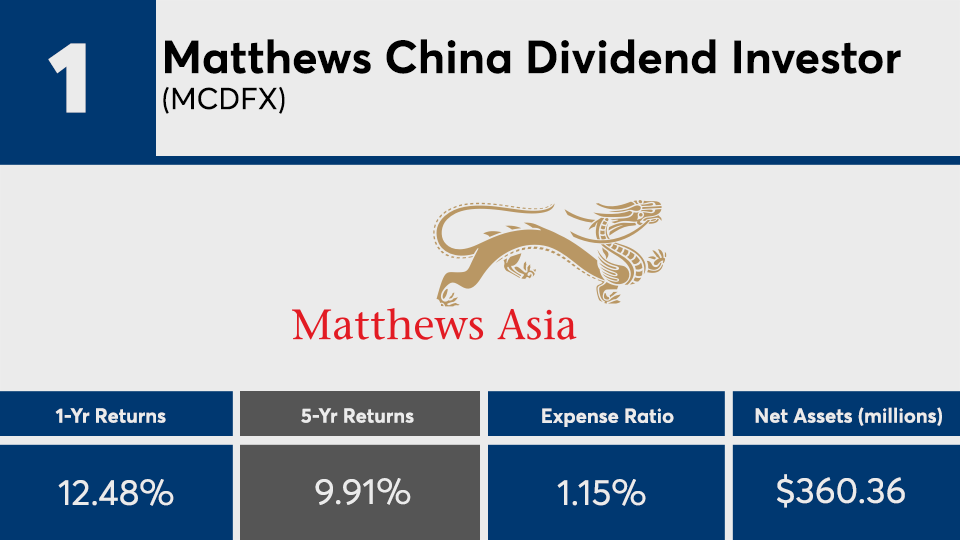
Scroll through to see the 20 top-performing China region category mutual funds, ETFs and closed end funds (with at least $100 million in assets under management) ranked by five-year annualized returns through Oct. 21. Funds with investment minimums over $100,000 were excluded, as were leveraged and institutional funds. Assets and expense ratios for each, as well as one-year daily returns, are also listed. The data shows each fund's primary share class. All data from Morningstar Direct.
