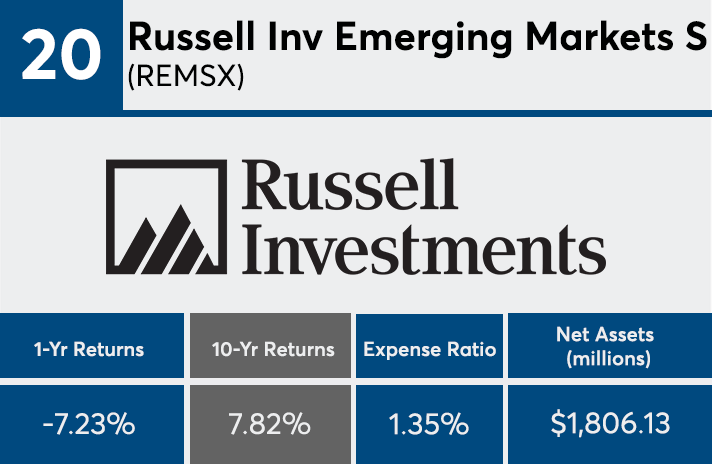
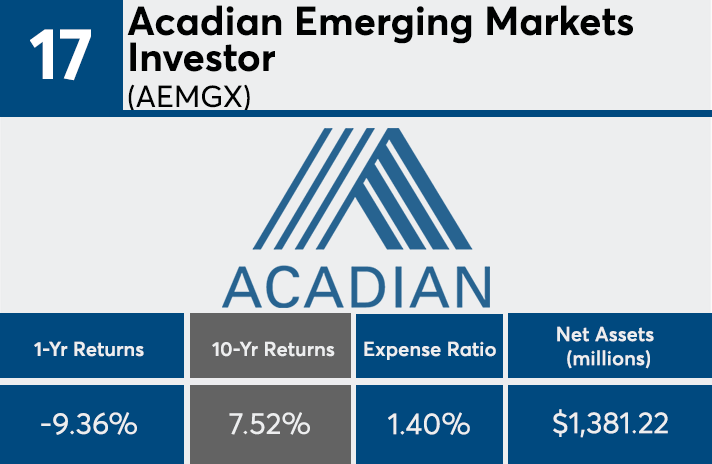
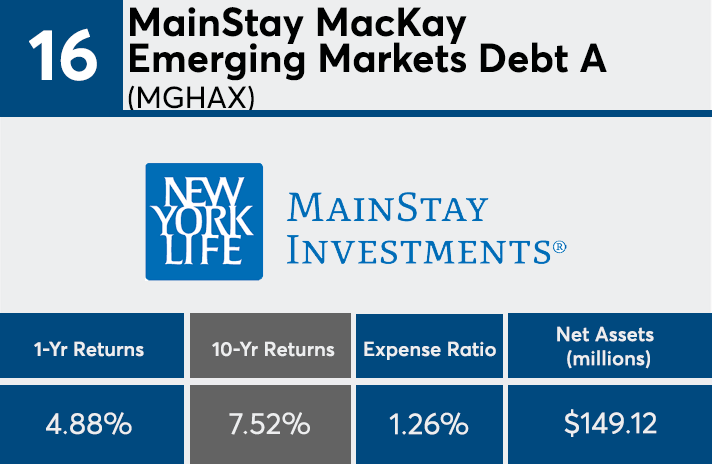
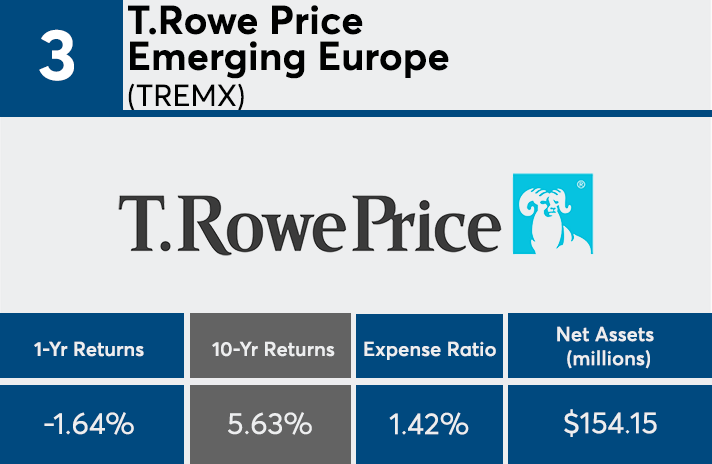
All of the decade’s worst-performing emerging markets funds posted long-term gains, but their 12-month trailing returns tell a different story about the sector.
Over the past 10 years, all emerging markets products (with at least $100 million in assets under management) reported returns well over 5%, Morningstar Direct data show. With an average 10-year gain of 6.74%, returns among the mutual funds and ETFs at the bottom of the barrel managed returns as high as 8%. For comparison;
“The long-running bull market has been the tide that lifted all ships as even the emerging market laggards over the past decade posted decent gains,” notes Greg McBride, senior financial analyst at Bankrate.
Year-over-year returns told a different story, however. With a combined $166.8 billion in AUM, the funds on this list averaged a 3.45% loss over the last 12 months, data show. “Despite 2019 being off to a strong start, the poor returns of 2018 are still a drag on trailing 12-month returns for many risk assets and especially high-octane sectors like emerging markets.”
These losses came at a significant cost to investors. With an average expense ratio of 1.07%, the worst-performers cost more than twice the price of the average 0.48% investors paid for fund investing last year, down from 0.51% in 2017, according to Morningstar’s most recent annual fee survey, which reviewed the asset-weighted average expense ratios of all U.S. open-end mutual funds and ETFs. For comparison, the 20 worst-performers were just 0.01% cheaper than the average top-performer, a point McBride stresses advisors should carefully consider when analyzing outliers in this category.
“Expense ratios are higher for actively managed emerging market funds than those in developed international markets or here in the U.S.,” McBride says. “Research costs are higher in emerging markets because companies may not have a current analyst following, the accounting can be tough to decipher or verify, and getting to far-flung, less-developed locales to do on-the-ground research can be pricey. All that adds up.”
Among the worst-performers is the Vanguard FTSE Emerging Markets ETF (VWO), the largest fund of the sector. The fund, which accounts for nearly 48% of all the assets in this list, has a 7.33% 10-year return and 0.12% expense ratio. A similar screen of the largest 20 funds, home to $306.9 billion in assets, shows only a slightly higher return of 9.53% and average expense ratio of 87 basis points.
Scroll through to see the 20 emerging markets category funds ranked by the lowest 10-year returns through April 25. Funds with less than $100 million in AUM and investment minimums over $100,000 were excluded, as were leveraged and institutional funds. Assets and expense ratios for each fund, as well as 1-year returns, are also listed. The data shows each fund's primary share class.
