Worst-performing large-cap funds of the decade

Complimentary Access Pill
Enjoy complimentary access to top ideas and insights — selected by our editors.

All but one of the decade’s worst-performing large-cap funds posted losses this year. That, however, isn't the only thing they have in common.

As growth funds dominate the top-performing large-cap funds over 10 years, it should be no surprise that value stocks have been the driving force behind the worst-performers. With an average 10-year gain of 7.92%, these funds underperformed their peers by more than five percentage points, Morningstar Direct data show. In 2020, they delivered an average loss of nearly 10%.

For comparison, index trackers such as the SPDR S&P 500 ETF Trust (SPY) — the industry’s biggest large-cap fund with more than $318.7 billion in AUM — and the SPDR Dow Jones Industrial Average ETF Trust (DIA) have 10-year returns of 13.30% and 12.09%, respectively. This year, SPY and DIA reported gains of 10.38% and 1.31%.

In bonds, the iShares Core U.S. Aggregate Bond ETF (AGG) had gains of 6.98% and 3.51% over the YTD and 10-year periods.

“Not all large-cap funds perform equally, even when their benchmark is some variant of the S&P 500,” says Steve Skancke, chief economic advisor at Keel Point. “In looking at the 10 best-performing funds, most of them are U.S. large-cap growth funds. The bottom-performing funds are mostly U.S. large-cap value funds. So the first point of difference between the top and bottom performing funds is the strategy they are pursuing.”

Another commonality among the worst performers: their higher-than-average fees. With a net expense ratio of 1.07%, these funds were more than twice the 0.45% investors paid for fund investing last year, according to Morningstar’s most recent annual fee survey.

“Overweighting one style over another has its own risks and rewards,” Skancke warns. “Many managers are blend managers which allow them to include growth companies in an otherwise value strategy, hence outperforming their value benchmarks when growth is the hot hand. The challenge for investors and investment advisors is to understand the manager’s style and whether the manager is able to achieve benchmark returns over time. Otherwise an allocation to growth, core or value is diluted by the underlying manager not delivering the benchmark performance expected.”

Scroll through to see the 20 large-cap funds with the worst 10-year returns through Nov. 6. Funds with less than $100 million in AUM were excluded, as were funds with investment minimums above $100,000, leveraged and institutional funds. Assets and expense ratios, as well as YTD, one-, three- and five- returns are also listed for each. The data show each fund's primary share class. All data is from Morningstar Direct.

FP110920_20 copy.png

BlackRock Basic Value Investor A (MDBAX)

1-Yr. Return: -6.05%
3-Yr. Annualized Return: 2.23%
5-Yr. Annualized Return: 4.57%
Front Load: 5.25%
FP110920_19 copy.png

Nuveen Large-Cap Value A (NNGAX)

1-Yr. Return: -9.56%
3-Yr. Annualized Return: -0.11%
5-Yr. Annualized Return: 4.22%
Front Load: 5.75%
FP110920_18 copy.png

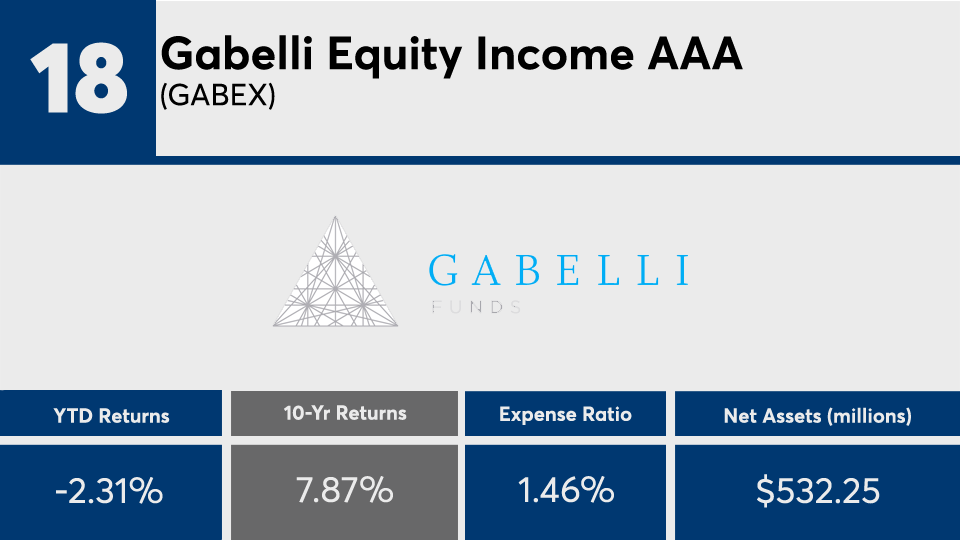
Gabelli Equity Income AAA (GABEX)

1-Yr. Return: 1.48%
3-Yr. Annualized Return: 3.58%
5-Yr. Annualized Return: 5.36%
Redemption Load: 2.00%
FP110920_17 copy.png

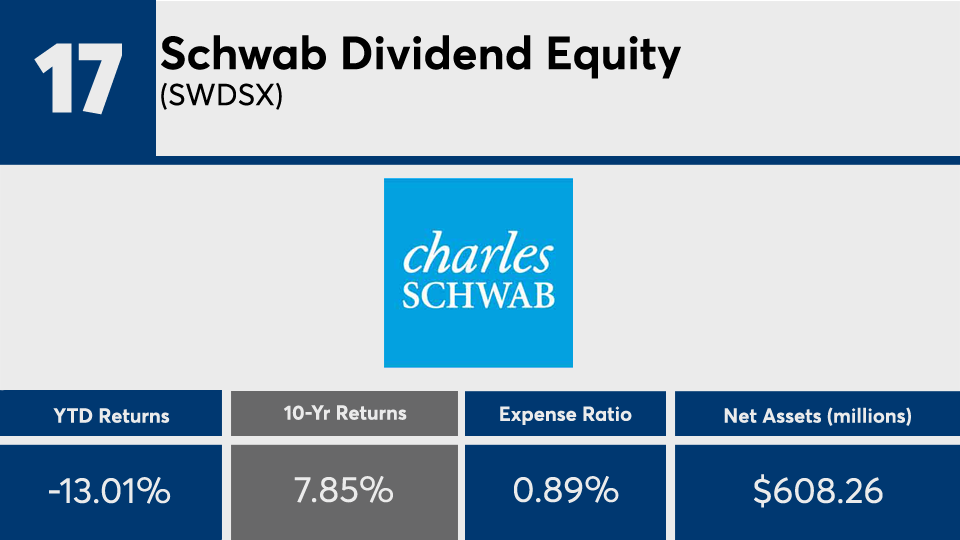
Schwab Dividend Equity (SWDSX)

1-Yr. Return: -9.99%
3-Yr. Annualized Return: -0.32%
5-Yr. Annualized Return: 3.36%
FP110920_16 copy.png

AllianzGI Dividend Value A (PNEAX)

1-Yr. Return: -5.95%
3-Yr. Annualized Return: 1.43%
5-Yr. Annualized Return: 5.51%
Front Load: 5.50%
FP110920_15 copy.png

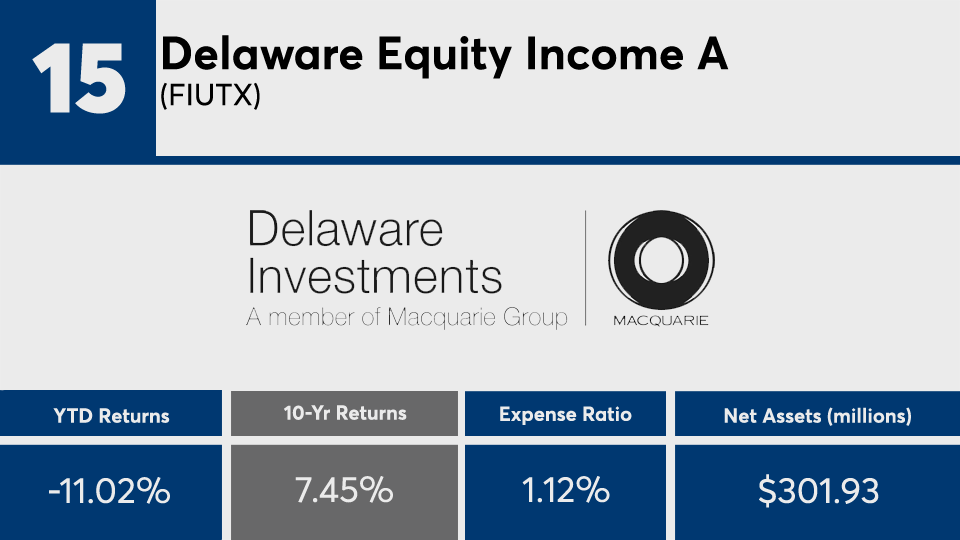
Delaware Equity Income A (FIUTX)

1-Yr. Return: -7.11%
3-Yr. Annualized Return: 0.98%
5-Yr. Annualized Return: 4.73%
Front Load: 5.75%
FP110920_14 copy.png

PGIM Jennison Value A (PBEAX)

1-Yr. Return: -1.98%
3-Yr. Annualized Return: 3.38%
5-Yr. Annualized Return: 5.36%
10-Yr. Annualized Return: 7.2031%
Front Load: 5.50%
FP110920_13 copy.png

Fidelity Blue Chip Value (FBCVX)

1-Yr. Return: -8.78%
3-Yr. Annualized Return: 0.21%
5-Yr. Annualized Return: 3.52%
10-Yr. Annualized Return: 7.1974%
FP110920_12 copy.png

City National Rochdale Dividend & Income N (RIMHX)

1-Yr. Return: -7.88%
3-Yr. Annualized Return: 1.66%
5-Yr. Annualized Return: 4.42%
FP110920_11 copy.png

Torray (TORYX)

1-Yr. Return: -12.65%
3-Yr. Annualized Return: -2.37%
5-Yr. Annualized Return: 2.82%
10-Yr. Annualized Return: 7.075%
FP110920_10 copy.png

AIG Strategic Value A (SFVAX)

1-Yr. Return: -7.73%
3-Yr. Annualized Return: -0.49%
5-Yr. Annualized Return: 3.44%
10-Yr. Annualized Return: 7.0741%
Front Load: 5.75%
FP110920_09 copy.png

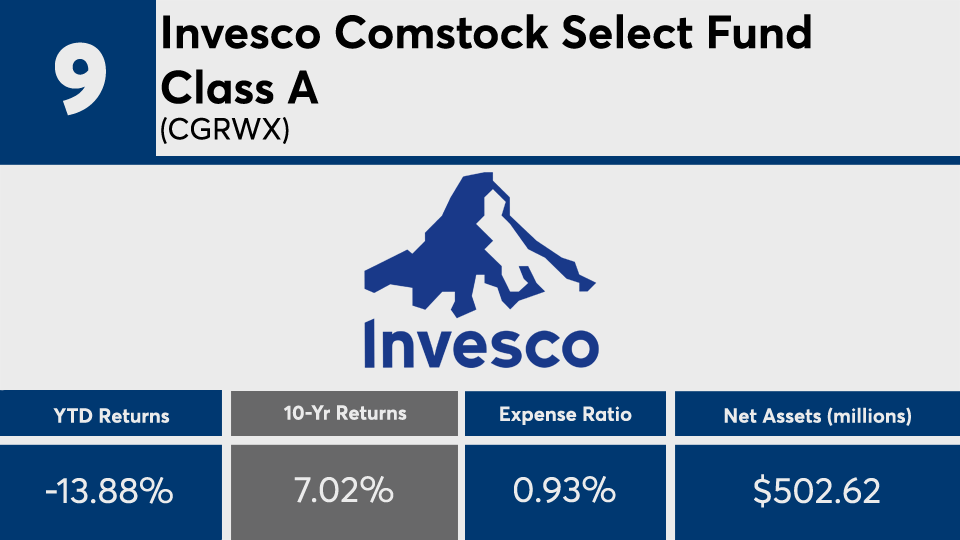
Invesco Comstock Select Fund Class A (CGRWX)

1-Yr. Return: -10.58%
3-Yr. Annualized Return: 0.33%
5-Yr. Annualized Return: 4.1%
Front Load: 5.50%
FP110920_08 copy.png

Hennessy Cornerstone Value Investor (HFCVX)

1-Yr. Return: -13.87%
3-Yr. Annualized Return: -1.45%
5-Yr. Annualized Return: 3.91%
FP110920_07 copy.png

AB Value Advisor (ABVYX)

1-Yr. Return: -7.76%
3-Yr. Annualized Return: -1.53%
5-Yr. Annualized Return: 1.89%
FP110920_06 copy.png

ClearBridge All Cap Value A (SHFVX)

1-Yr. Return: -10.84%
3-Yr. Annualized Return: -2.08%
5-Yr. Annualized Return: 3.8%
Front Load: 5.75%
FP110920_05 copy.png

Invesco Low Volatility Equity Yield A (SCAUX)

1-Yr. Return: -5.98%
3-Yr. Annualized Return: -0.94%
5-Yr. Annualized Return: 2.91%
Front Load: 5.75%
FP110920_04 copy.png

Longleaf Partners (LLPFX)

1-Yr. Return: -3.74%
3-Yr. Annualized Return: -2.2%
5-Yr. Annualized Return: 3.46%
FP110920_03 copy.png

Muhlenkamp (MUHLX)

1-Yr. Return: 6.48%
3-Yr. Annualized Return: 1.86%
5-Yr. Annualized Return: 2.39%
10-Yr. Annualized Return: 4.7869%
FP110920_02 copy.png

Virtus FORT Trend Fund Class A (VAPAX)

1-Yr. Return: -5.49%
3-Yr. Annualized Return: 0.87%
5-Yr. Annualized Return: 2.77%
10-Yr. Annualized Return: 4.7857%
Front Load: 5.75%
FP110920_01 copy.png

CGM Realty (CGMRX)

1-Yr. Return: -5.04%
3-Yr. Annualized Return: -5.17%
5-Yr. Annualized Return: 1%
MORE FROM FINANCIAL PLANNING